
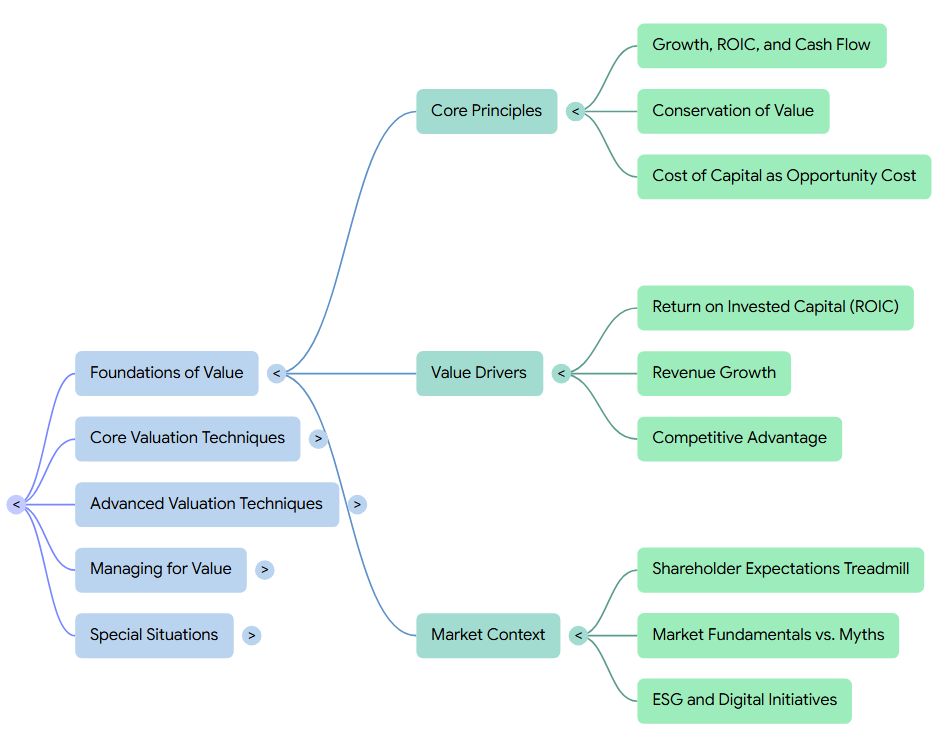
In the book, “Foundations of Value” serves as the conceptual and economic bedrock for the entire discipline of corporate valuation. It establishes that while stock markets can fluctuate and corporate strategies can shift, the core principles governing whether a business creates or destroys value are universal, enduring, and mathematically provable.
In the larger context of measuring and managing corporate value, the book organizes these foundations around several core pillars:
1. The Core Axiom: Growth, ROIC, and Cash Flow
The most fundamental principle of value creation is that companies create value only when they grow and earn a return on invested capital (ROIC) that exceeds their cost of capital. This relationship is mathematically locked.
- The Formula: The book represents this via the Key Value Driver Formula:
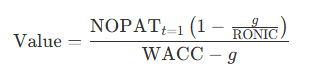
- The Interaction: Value is determined by the interaction of growth (g), return on capital (ROIC/RONIC), and the cost of capital (WACC).
- The Value-Creation Boundary: A vital lesson for managers is that growth is not inherently good. If a company’s ROIC is greater than its cost of capital, faster growth increases its value. However, if ROIC is below the cost of capital, growing faster actually destroys value because the company is forced to invest more capital at a rate of return that does not cover its opportunity cost. Consequently, high-ROIC companies should prioritize growth, while low-ROIC companies must focus on improving returns before trying to expand.
2. The Conservation of Value Principle
A direct corollary of the core axiom is the conservation of value: anything that does not increase cash flows does not create value.
- Value is conserved (unchanged) when a company merely alters the ownership of claims to its cash flows (e.g., substituting debt for equity or using financial engineering to buy back shares).
- Accounting vs. Reality: Changing the accounting appearance of cash flows without changing the actual cash flows (such as changing depreciation methods, inventory accounting, or expensing vs. disclosing stock options) does not alter a company’s intrinsic value.
- Common Fallacies: The book warns managers against falling for financial illusions. For example, acquisitions often fail to create value because buyers focus on whether a transaction is “earnings per share (EPS) accretive” rather than whether the combined cash flows will actually increase through tangible operational synergies. The stock market eventually sees through accounting “gimmicks” and multiple expansions that lack fundamental backing.
3. Shareholder Capitalism, Short-Termism, and Stakeholders
The book addresses the modern crisis of trust in capitalism by drawing a sharp line between maximizing long-term intrinsic value and maximizing short-term profits or share prices.
- The Cost of Short-Termism: Pressured by quarterly targets, many executives sacrifice long-term value by cutting R&D, skimping on customer service, or underinvesting in employee training to hit short-term EPS consensus estimates. In a survey cited in the book, fully 80% of CFOs admitted they would reduce discretionary spending on value-creating activities like marketing and R&D to meet short-term earnings targets.
- Reconciling Stakeholders: The book argues that long-term shareholder value creation and broader stakeholder interests (such as those of customers, employees, suppliers, and communities) are fundamentally complementary. Companies cannot build sustainable, long-term value for shareholders if they ignore product safety, underpay employees, pollute the environment, or alienate suppliers, as the resulting reputational damage and regulatory fines will eventually destroy shareholder value.
4. The Expectations Treadmill and Market Smarts
While short-term stock prices can occasionally drift from fundamentals due to speculative bubbles or “noise traders”, the stock market is smarter than most think. In the long run, stock prices track ROIC and organic growth.
- The Expectations Treadmill: For public companies, the return that shareholders actually earn is driven heavily by changes in the market’s expectations rather than the company’s standalone performance.
- The Treadmill Effect: When a company outperforms expectations, its share price rises. However, this quickens the speed of the “treadmill” because the higher stock price now embeds even higher expectations. Managers must then perform even better just to keep the stock price stable, making it virtually impossible for high-performing companies to continuously beat the market over extended periods.
5. Risk and the Cost of Capital as an Opportunity Cost
A critical foundation of valuation is understanding that the cost of capital is not a cash cost, but an opportunity cost. It represents the return investors could expect to earn on alternative investments of similar risk.
- Diversifiable vs. Nondiversifiable Risk: Only nondiversifiable (systematic) risk—the risk that investors cannot eliminate by holding a diversified portfolio—is priced into the cost of capital.
- Handling Project Risk: Because unique project risks (such as a drug failing clinical trials or political instability in an emerging market) are diversifiable, the book strongly advises against adding arbitrary, ad-hoc risk premiums to the discount rate. Bumping up the discount rate is a crude shortcut that systematically penalizes future cash flows and kills good projects. Instead, managers should explicitly model risks into their cash flow projections using multiple probability-weighted scenarios, keeping the discount rate at the unadjusted cost of capital.
Core Principles
In the book, the “Foundations of Value” is anchored by two immutable Core Principles of value creation. These principles are not merely abstract theories; they are mathematically locked economic rules that apply universally across time, geography, and different market conditions.
In the larger context of corporate valuation, these core principles dictate how cash flows are generated, how corporate strategies succeed or fail, and how the stock market ultimately prices companies.
1. The First Core Principle: The Growth, ROIC, and Cash Flow Link
The first core principle of value creation states that return on invested capital (ROIC) and revenue growth are the twin engines that drive free cash flow, which in turn drives a company’s intrinsic value.
- The Mathematical Link: This principle is formally expressed through the Key Value Driver Formula:
This formula demonstrates that a company’s value is governed strictly by the interaction of its growth (), its return on capital (ROIC), and its cost of capital (WACC).
- The Value-Creation Boundary: A critical implication of this principle is that growth only creates value if a company’s ROIC exceeds its cost of capital. If a company’s ROIC matches its WACC, growth is value-neutral—the company is simply on a “treadmill” where harder work yields no added value. If ROIC falls below WACC, faster growth actually accelerates value destruction because the company must invest more capital at returns that do not cover its opportunity cost.
- The Interaction in Practice:The book illustrates this principle using several real-world examples:
- Costco vs. Brown-Forman: From 1996 to 2017, slow-growing Brown-Forman (7% annual profit growth) generated the same 15% annual shareholder returns as the fast-growing retailer Costco (11% annual profit growth). This occurred because Brown-Forman offset its lower growth with a far superior ROIC of 29%, compared to Costco’s 13% ROIC, proving that high growth is not the only path to value.
- Rockwell Automation: From 1995 to 2018, Rockwell delivered top-quartile shareholder returns of 19% per year, even though its revenues actually shrank from $13 billion to $7 billion. It achieved this remarkable value creation by divesting lower-margin divisions and focusing strictly on its core industrial-automation business, which skyrocketed its ROIC from 12% to 35%.
- Strategic Implications for Managers: High-ROIC companies typically generate the most incremental value by focusing on growth, whereas low-ROIC companies create far more value by improving their returns before attempting to scale. Additionally, different types of growth create different amounts of value; organic growth via new products generally creates the most value because it requires minimal upfront capital, while growth through large acquisitions typically creates the least due to the heavy premiums paid to target shareholders.
2. The Second Core Principle: The Conservation of Value
The second core principle is a direct corollary of the first: anything that does not increase cash flows does not create value. Value is conserved, meaning it remains unchanged, if a transaction merely redistributes existing cash flows among different claimants without expanding the overall cash-generating power of the business.
The book traces this concept to the pioneering work of Nobel laureates Franco Modigliani and Merton Miller. It highlights several key areas where managers frequently violate this principle by chasing “accounting illusions” rather than cash reality:
- Accounting Gimmicks and Changes: Altering the appearance of cash flows without changing the underlying economic reality does not alter a company’s value.
- For example, the stock prices of companies did not drop when the FASB mandated the expensing of employee stock options in 2004. The stock market was not fooled; it had already incorporated the dilutive cost of these options in its valuations based on footnote disclosures.
- Similarly, when goodwill amortization was eliminated in the early 2000s, reported earnings rose, but stock prices remained unchanged because the accounting shift had zero impact on underlying cash flows.
- Share Repurchases: Share buybacks are widely believed to create value because they instantly boost earnings per share (EPS). However, the conservation of value principle exposes this as a fallacy. Funding a buyback with cash or debt increases a company’s financial leverage and risk, which drives down its price-to-earnings () multiple to perfectly offset the EPS boost. Buybacks only create value indirectly if they signal management’s capital discipline or prevent executives from squandering excess cash on low-return projects.
- Acquisitions and Multiple Expansion: Many acquisitions are justified on the ground of “multiple expansion”—the hope that the market will automatically revalue the target’s earnings at the buyer’s higher multiple. The book states that no empirical evidence supports this fallacy; acquisitions only create value when the combined entity generates tangible cost reductions, synergies, or capital efficiencies that expand the total cash flow pool.
- Financial Engineering: Capital markets do an excellent job of pricing complex financial instruments. Tools like derivatives, structured debt, and off-balance-sheet leasing do not inherently create value unless they reduce taxes, lower the cost of capital, or provide operational flexibility.
The Broader Market and Strategic Context
Within the larger context of the book, these Core Principles serve as a vital reality check against short-termism. Many corporate leaders mistakenly conflate maximizing long-term intrinsic value with maximizing short-term profits or share prices. Under pressure to meet quarterly EPS targets, executives frequently cut discretionary value-creating expenditures like R&D, customer service, or employee training. In fact, a cited survey reveals that 80% of CFOs would cut discretionary spending on R&D and marketing to meet short-term earnings targets.
The book argues that the stock market is smarter than most managers think; while “noise traders” can cause short-term price deviations, in the long run, market valuations inevitably align with a company’s fundamental ROIC and organic growth. Understanding these core principles equips managers with the courage to make decisions that prioritize long-term, sustainable value creation for both shareholders and broader stakeholders.
Growth, ROIC, and Cash Flow
In the book, the relationship between Growth, Return on Invested Capital (ROIC), and Cash Flow represents the core operational engine of corporate finance, serving as the practical execution of the first core principle of value creation. While managers often track these metrics in isolation, the book locks them together in a strict mathematical and strategic framework, demonstrating that they are entirely interdependent.
1. The Mathematical Link: How They Interlock
The book notes that companies create value by investing cash today to generate more cash in the future. To understand how value is generated, cash flow must be disaggregated into its fundamental drivers: growth and ROIC. These variables are mathematically linked through a company’s investment rate (the percentage of profits reinvested back into the business):
- Growth is the product of return on capital and investment:

- Free Cash Flow (FCF) is NOPAT (net operating profit after taxes) minus net investment, which can be rewritten to show its dependence on ROIC and growth:

Because of this link, near-term cash flow by itself can be a highly misleading indicator of performance. For instance, if a high-performing company finds a new opportunity to accelerate its growth, its near-term cash flow will actually decrease because it must reinvest a larger portion of its earnings to fund that growth. However, its long-term value will increase dramatically because those upfront investments will yield significantly higher cash flows in the future.
2. The Value-Creation Boundary
The interaction of growth and ROIC dictates whether a company is building or destroying value. This boundary is governed by the Value Driver Formula:
This formula establishes a critical operational boundary for corporate strategy:
- When ROIC exceeds the cost of capital (WACC), faster growth requires reinvestment but ultimately increases the company’s intrinsic value.
- When ROIC is less than WACC, growing faster requires investing more capital at a value-destroying rate of return, which actually reduces the company’s value.
- When ROIC equals WACC, growth is completely value-neutral. The company is on a “treadmill” where working harder and growing larger yields no added value for shareholders.
- Improving ROIC, regardless of growth, always increases value because it reduces the amount of capital that must be reinvested to achieve a given level of growth.
3. Strategic Priorities: High-ROIC vs. Low-ROIC Companies
Understanding how these variables interact is essential for managers setting strategic priorities. The book shows that the value-creating payoff of choosing growth versus improving ROIC depends heavily on a company’s starting position:
- High-ROIC Companies Should Prioritize Growth: A typical high-ROIC firm (such as a branded consumer packaged-goods company) gets a much larger value boost from a 1-percentage-point increase in growth (e.g., a 10% increase in value) than from a 1-percentage-point increase in ROIC (e.g., a 6% increase in value).
- Low-ROIC Companies Must Prioritize Returns: Conversely, a moderate- or low-ROIC company (such as a typical retailer) gets a massive 15% bump in value from a 1-percentage-point increase in ROIC, but only a 5% increase from faster growth. For these firms, the book warns that faster growth rarely solves a fundamental profitability problem. Low-ROIC companies must fix their operational model to improve returns before attempting to grow.
4. The Pecking Order of Growth
Finally, the book points out that not all growth is equal. Different expansion strategies yield different returns on capital, creating a distinct “pecking order” of value creation:
- Organic new-product development typically creates the most value (averaging $1.75 to $2.00 of value per $1.00 of incremental revenue) because it is capital-light and can be executed using existing factories and distribution systems.
- Acquisitions sit at the bottom of the pecking order. They require massive, immediate upfront payments that include a takeover premium. Even if the acquirer successfully improves the target, the resulting rate of return typically exceeds the cost of capital by only a small margin, yielding the lowest value per dollar of revenue.
Conservation of Value
In the book, the Conservation of Value is presented as one of the two foundational core principles of corporate finance and value creation. While the first core principle dictates how return on invested capital (ROIC) and growth interact to drive cash flow and intrinsic value, the conservation of value acts as a vital economic boundary.
In the larger context of the book’s teachings on value measurement and management, this principle serves as an essential filter to help managers distinguish between genuine wealth creation and accounting or financial illusions.
1. The Core Definition and Theoretical Foundation
The conservation of value is defined as a direct corollary of the discounted cash flow (DCF) model: anything that does not increase cash flows (or reduce risk) does not create value. Consequently, value is conserved—meaning it remains entirely unchanged—when a company merely redistributes the ownership of claims to its cash flows or alters the accounting appearance of those flows without changing the underlying economic reality.
The book traces the intellectual origin of this principle to the pioneering, Nobel Prize-winning work of financial economists Franco Modigliani and Merton Miller. In 1958, they mathematically proved that a company’s total value is unaffected by changing its mix of debt and equity unless the transaction alters the total cash flows generated by the underlying business (such as by reducing corporate income taxes). To illustrate, if an all-equity company worth $1,000 borrows $200 to pay a dividend to its shareholders, the total enterprise value remains exactly $1,000 ($200 in debt claims and $800 in equity claims), because the company’s operating cash flows have not changed.
2. Accounting Illusions vs. Cash Reality
The book details how well-functioning capital markets are deeply rooted in cash fundamentals and are not easily fooled by paper transactions or accounting gimmicks that temporarily inflate reported profits. It highlights two prominent historical examples of this market efficiency:
- Employee Stock Options: For decades, executives fought against expensing employee stock options on the income statement, fearing a negative share price reaction. However, when the rules were updated in the early 2000s to mandate expensing, stock prices did not decline. Because options dilute existing shareholders’ claims when exercised, sophisticated investors had already factored this cost into their valuations using footnotes long before the accounting change occurred.
- Goodwill Amortization: When accounting boards (FASB in 2002 and IASB in 2005) eliminated the mandatory amortization of goodwill, companies reported an immediate jump in paper profits. However, their underlying values and stock prices remained unchanged because the accounting shift had absolutely zero impact on cash flows.
3. Application to Key Corporate Decisions
The book argues that the conservation of value is a highly practical tool for managers because it isolates the only metric that matters: the cash flow impact and nothing else. It applies this framework to three major areas where executives frequently chase illusions:
Share Repurchases
A widespread corporate fallacy is that share buybacks create value simply because they reduce the share count and instantly boost earnings per share (EPS). Under the conservation of value, buybacks are inherently value-neutral. If a company borrows money to retire equity, its financial leverage rises. This added debt increases risk and volatility for the remaining equity holders, who in turn demand a higher return—driving down the company’s price-to-earnings () multiple to perfectly offset the EPS boost. Buybacks only generate real value indirectly if they act as a capital discipline mechanism, preventing management from wasting excess cash on low-return projects.
Mergers and Acquisitions (M&A)
Acquisitions only create value when the combined entity generates cost savings, accelerated revenue growth, or capital efficiencies that expand the total cash flow pool. The book heavily critiques the concept of “multiple expansion”—the hope that the market will automatically revalue a target’s earnings at the buyer’s higher multiple. If Company A (worth $100) buys Company B (worth $50) and no operational synergies are achieved, the combined company AB is worth exactly $150. The stock market will not expand the target’s multiple without tangible operational improvements.
Financial Engineering
The book defines financial engineering as utilizing financial instruments or structures (such as derivatives, structured debt, or off-balance-sheet leasing) to manage capital structure. Most financial engineering is value-neutral. It only creates real value when it increases cash flows directly, such as by exploiting tax laws. For instance, separating hotel ownership and operations into Real Estate Investment Trusts (REITs) eliminates corporate-level taxes, resulting in higher aggregate cash flows for investors. Similarly, sale-leaseback transactions only add value if they transfer risk effectively or utilize tax depreciation benefits more efficiently.
Conclusion
Ultimately, within the broader context of the book, the Conservation of Value serves as a vital reality check. It demands that corporate leaders look past short-term EPS targets, reported earnings, and accounting structures to ask a single, disciplined question of any strategic initiative: “Where is the source of the cash flow creation?”. If a manager cannot pinpoint a tangible improvement to operational cash flows or a reduction in systematic risk, the proposed transaction is almost certainly an illusion.
Cost of Capital as Opportunity Cost
In the book, the cost of capital is established as a critical hurdle rate for determining value creation and evaluating strategic decisions. Under the first core principle of corporate finance, a company only creates value when its return on invested capital (ROIC) exceeds its cost of capital. If the ROIC is at or below this rate, growth fails to generate value.
1. The Essence of Opportunity Cost
A foundational tenet in the book is that the cost of capital is not a cash cost; it is an opportunity cost.
- Investor-Driven Benchmark: It represents the expected return investors could earn by investing their funds elsewhere in alternative investments of similar risk.
- Fiduciary Alignment: This definition is directly rooted in the fiduciary relationship between managers and shareholders. Because corporate executives act as the agents of investors, they have a responsibility to only invest in projects that yield returns equal to or greater than what those investors could achieve on their own in the capital markets. This is why the cost of capital is used interchangeably with “expected return” or “required return”.
- Granular Application: When valuing individual business units or distinct projects, the correct cost of capital is what investors could expect to earn in other similarly risky projects, rather than the overall cost of capital of the parent company.
2. The Danger of Confusing Funding with Risk
Executives frequently fail to incorporate the opportunity cost framework correctly by associating specific funding streams with specific investments.
- The Debt Funding Fallacy: When acquiring a company, a buyer might raise debt to fund the entire transaction and mistakenly apply the cheap cost of debt as the discount rate for the target’s cash flows.
- Risk Determines the Rate: The book warns that the cost of capital is determined strictly by the riskiness of the acquired company’s operating cash flows, not by how it is financed or the creditworthiness of the parent company. The risk of a target’s operating cash flows is vastly different from the risk of a bondholder’s cash flows. Using the cost of debt as a discount rate ignores this reality and can easily lead a company to overestimate a target’s value by up to two times.
3. Systematic Risk vs. Diversifiable Risk
Because the cost of capital represents the opportunity cost of a diversified investor, the book emphasizes that only systematic, nondiversifiable risk should be reflected in the discount rate.
- Diversification Benefits: Since investors can cheaply diversify their portfolios, they do not require compensation for risks that can be eliminated through diversification (such as unique project failures or technological setbacks).
- Scenarios Over Ad-Hoc Premiums: Bumping up the cost of capital with arbitrary, ad-hoc risk premiums to compensate for project-specific risks is a crude shortcut. This practice embeds opaque, gut-feel assumptions into the valuation, which can easily slash estimated value by half and cause companies to reject excellent, value-creating opportunities.
- The Correct Approach: Instead, managers should explicitly model diversifiable risks directly into the expected cash flow projections using multiple probability-weighted scenarios. These scenarios should then be discounted at the unadjusted opportunity cost of capital. This ensures full transparency, encourages risk-mitigation strategies, and aligns decisions with the true economic boundaries of value creation.
Value Drivers
In the book, value drivers represent the practical, operational variables that managers must influence to execute the core principles of corporate valuation. While the “Foundations of Value” establishes the overarching economic and mathematical laws of value creation, value drivers bridge the gap between high-level financial mathematics and day-to-day corporate operations.
By disassembling value creation into granular, manageable drivers, the book provides a structured framework for setting targets, allocating resources, and diagnosing corporate health.
1. The Financial Value Drivers (The Mathematical Foundation)
At the highest level, the foundations of valuation are locked into a single mathematical formula known as the Key Value Driver Formula:
This formula mathematically proves that a company’s intrinsic value and its earnings multiples are driven by three fundamental financial metrics: revenue growth (g), return on invested capital (ROIC), and the weighted average cost of capital (WACC).
- The Investment Rate Connection: The formula models the exact relationship between growth and required reinvestment. Improving ROIC always increases value because it reduces the amount of capital that must be reinvested to fund any given level of growth.
- The Strategic Payoff: High-ROIC companies generate the most incremental value by focusing on growth, whereas low-ROIC companies create far more value by improving their returns before attempting to grow.
2. Operationalizing the Math: The Value Driver Tree
Because business unit and segment managers cannot directly manipulate “ROIC” or “WACC” on a spreadsheet, the book advocates using a value driver tree. This visual and analytical tool systematically cascades high-level financial metrics down to specific short-, medium-, and long-term operational metrics that employees can actually control.
[Sales Productivity] ——> (Commercial Health) —–> [Strategic Health]
[Growth] —–> [Operating-Cost] ———-> (Cost Structure) ——–> [Organizational Health]
[Capital Productivity] —-> (Asset Health)
A. Short-Term Value Drivers
These are immediate, highly quantifiable operational metrics of growth and capital efficiency that can be monitored frequently (e.g., monthly or quarterly). They are divided into three areas:
- Sales Productivity: Price, units sold, market share, and same-store sales growth.
- Operating-Cost Productivity: Unit labor costs, raw materials costs, and direct manufacturing margins.
- Capital Productivity: Operational efficiency in managing working capital (inventories, receivables, payables) and property, plant, and equipment (PP&E).
B. Medium-Term Value Drivers
These drivers look forward over a one-to-five-year horizon to indicate whether current financial performance is sustainable. They include:
- Commercial Health: Brand strength, product pipeline quality, and customer satisfaction.
- Cost Structure Health: A company’s structural ability to manage costs relative to competitors over time (using systems like Six Sigma).
- Asset Health: How well a company maintains and develops its physical assets, such as the remodel cycle for retail locations or the average age of a shipping fleet.
C. Long-Term Value Drivers
These are qualitative or milestone-oriented indicators that reflect a company’s ability to sustain its core business and capture new opportunities over a decade or more.
- Strategic Health: The ability to sustain the core business while successfully identifying and seeding new growth opportunities before competitors do.
- Organizational Health: Measuring whether the company has the right people, skills, and corporate culture to sustain high performance.
3. Key Managerial Implications of Value Drivers
The book emphasizes that a clear understanding of these drivers provides several critical strategic benefits:
- Evaluating True Performance vs. Short-Term Illusion: Short-term financial metrics can be easily manipulated. For example, a business unit can boost its short-term ROIC and profits by price-gouging or cutting back on R&D and brand advertising. However, analyzing medium-term value drivers (like customer satisfaction or pipeline health) will instantly flag that the company is destroying its long-term health to chase short-term metrics.
- Navigating Strategic Trade-Offs: Building long-term value requires investing cash in areas (like R&D or employee training) that depress short-term cash flows and ROIC. A robust value driver framework gives boards and executives the courage to defend these necessary short-term dips because they can visually trace how today’s investments build tomorrow’s value.
- Tailoring Initiatives to the Business Model: Value drivers must be customized to a company’s specific industry. For instance, a manufacturing company’s tree will focus on capacity utilization and error rates, whereas a grocery retailer’s tree will focus on average basket size, markdowns, and inventory turns. This prevents companies from wasting resources on low-value-creation activities.
Return on Invested Capital (ROIC)
In the book, Return on Invested Capital (ROIC) is established as a core financial value driver that sits alongside revenue growth at the pinnacle of the corporate valuation hierarchy. Together, growth and ROIC represent the primary financial engines that generate free cash flow and determine a company’s intrinsic value.
However, because high-level financial metrics like ROIC cannot be managed directly on a day-to-day basis, the book contextualizes ROIC within a comprehensive framework of value drivers that translate financial mathematics into actionable operational metrics.
1. The Value-Creation Hurdle
In the key value driver formula, ROIC serves as the ultimate arbiter of whether corporate expansion builds or destroys shareholder wealth.
- The Hurdle Rate Boundary: A company only creates value when its ROIC exceeds its cost of capital (WACC).
- The Growth Boundary: Growth is not inherently beneficial; only if ROIC exceeds the cost of capital will growth increase a company’s value. If ROIC is below WACC, faster growth requires investing more capital at a rate of return that fails to cover its opportunity cost, thereby accelerating value destruction.
- Reinvestment Efficiency: Improving ROIC, for any level of growth, always increases a company’s value because it reduces the investment rate required to achieve that growth.
2. Disaggregating ROIC into Operating Drivers
To make ROIC analytically useful, the book disassembles the metric into its core operational components. This disaggregation is considered one of the most powerful tools in financial analysis:

This equation demonstrates that ROIC is driven by three key operational levers:
- Operating Profit Margin (EBITA/Revenues): Reflecting a company’s operating profitability.
- Capital Turnover (Revenues/Invested Capital): Reflecting how productively a company utilizes its capital base.
- Operating Cash Tax Rate: Reflecting tax efficiency.
At a more granular, unit level, ROIC can be expressed in terms of price per unit, cost per unit, and invested capital per unit. To earn a higher ROIC, a company must possess a competitive advantage that allows it to either charge a price premium (driving up margins) or operate with greater cost and capital efficiency (driving down cost per unit or invested capital per unit).
3. Cascading ROIC Down the Value Driver Tree
The book advocates the use of a value driver tree to systematically connect high-level ROIC to specific, manageable metrics across different horizons:
- Short-Term Operating Drivers: These are highly quantifiable, immediate levers that directly feed the ROIC formula. They include operating-cost productivity (such as unit labor and raw materials costs, which dictate the operating margin) and capital productivity (such as days of inventory, accounts receivable, and PP&E efficiency, which dictate capital turnover).
- Medium-Term Drivers: Over a one-to-five-year horizon, variables such as cost structure health (relative cost advantages) and asset health (maintenance and capital upgrades) act as leading indicators of whether the company’s current ROIC is sustainable or decaying.
- Long-Term Drivers: Over a decade or more, organizational health (talent, culture, and skills) and strategic health (the ability to secure new growth options and defend the core business against market entry) underpin the long-term persistence of high capital returns.
4. Setting Strategic Priorities Based on ROIC
Finally, the book details how a company’s current ROIC performance must guide its strategic resource allocation and choices among alternative value drivers:
- High-ROIC Companies: Companies that already earn a high ROIC (such as typical branded consumer packaged-goods firms) should focus primarily on growth. Because their returns already far exceed the cost of capital, incremental growth generates significantly more value for them than a comparable marginal increase in ROIC. Indeed, they should be willing to accept slightly lower returns on new projects if it enables faster growth, as long as those returns remain above WACC.
- Low-ROIC Companies: Companies with low returns (such as typical capital-intensive retailers or airlines) must focus on improving ROIC before attempting to expand. For these firms, faster growth spreads fixed costs but rarely cures a structurally flawed business model. Instead, they achieve a massive value boost from a 1-percentage-point increase in ROIC.
- Margin vs. Capital Productivity: When improving ROIC, the book notes that at moderate-to-high returns, a 1-percentage-point ROIC increase achieved through margin improvement creates substantially more value than the same increase achieved through capital productivity (such as reducing working capital). This is because margin improvement increases ongoing profit streams, whereas capital productivity improvements often generate only a one-time cash inflow.
By mapping these operational and strategic connections, the value driver framework in the book ensures that managers do not chase growth or returns blindly, but instead focus on the specific, tailored levers that yield the highest economic value.
Revenue Growth
In the book, revenue growth is established as one of the two primary financial value drivers—alongside Return on Invested Capital (ROIC)—that sit at the pinnacle of the corporate valuation hierarchy. Together, growth and ROIC are the operational engines that determine a company’s free cash flow, which ultimately dictates its intrinsic value.
However, the book emphasizes that revenue growth cannot be analyzed in a vacuum. Its capacity to create value is strictly bounded by economic fundamentals and the strategic source of that growth.
1. The Core Economic Boundary: Growth vs. ROIC
A central tenet of the book is that growth is not inherently beneficial; it only creates value when a company’s ROIC exceeds its cost of capital (WACC).
- Value-Creating Growth: When ROIC is greater than WACC, faster revenue growth requires capital reinvestment but ultimately results in higher future cash flows, boosting the company’s intrinsic value. High-ROIC companies should prioritize growth over further margin improvements, as revenue expansion is the more powerful value driver for them.
- Value-Neutral Growth: When ROIC exactly matches WACC, growth is value-neutral. The company is on a “treadmill” where growing larger adds zero value for shareholders.
- Value-Destroying Growth: When ROIC is below WACC, growing faster requires investing capital at returns that do not cover its opportunity cost, thereby accelerating value destruction. Low-ROIC companies must focus on improving operational profitability and capital productivity to raise ROIC before trying to grow, as faster growth rarely solves a structural return problem.
2. Disaggregating the Drivers of Revenue Growth
To evaluate a company’s growth potential and performance, the book advises managers to disaggregate historical and projected revenue growth into three core drivers:
- Portfolio Momentum: The organic revenue growth a company enjoys simply due to the expansion of the market segments represented in its portfolio. In large companies, this is by far the most important driver of long-term revenue growth.
- Market Share Performance: The organic growth (or reduction) a company achieves by gaining or losing share within its specific markets. This is generally the least important driver of long-term growth, as competitors in mature markets will aggressively retaliate.
- Mergers and Acquisitions (M&A): The inorganic growth achieved by buying or selling revenues through transactions.
3. The Value Creation Hierarchy (The “Pecking Order” of Growth)
Not all revenue growth is created equal. Different growth strategies yield different returns on capital, creating a distinct “pecking order” of value creation per dollar of incremental revenue:
- Introducing New Products (Organic): This sits at the very top of the hierarchy (typically creating $1.75 to $2.00 of value per $1.00 of incremental revenue). It is highly valuable because it requires minimal immediate capital—leveraging existing factory lines and distribution networks—and faces no established competitors.
- Expanding an Existing Business / Attracting New Customers: This also has high value-creating potential because direct competitors generally benefit from the overall category expansion, lowering the risk of retaliation.
- Gaining Share in Mature Markets: This creates very little value. Battles for market share through price promotion or incremental innovation in slow-growth markets provoke rapid retaliation, dragging down industry margins.
- Acquisitions (Inorganic): This sits at the bottom of the pecking order. Acquisitions require massive upfront cash payments that include a takeover premium paid to the target’s shareholders, resulting in a lower ROIC and lower value creation compared to organic growth.
4. Operationalizing Growth in the Value Driver Tree
Because segment managers cannot directly control “aggregate revenue growth,” the book utilizes the value driver tree to cascade high-level growth down to manageable operational and qualitative metrics across different time horizons:
- Short-Term Operating Drivers: Highly quantifiable, immediate metrics of sales productivity—such as pricing, unit volume, transactions per square foot, and same-store sales growth (“comps”).
- Medium-Term Drivers: Forward-looking leading indicators of commercial health over a one-to-five-year horizon, including brand strength (investments in brand building), customer satisfaction, and product pipeline quality.
- Long-Term Drivers: Qualitative milestones of strategic health over a decade or more, reflecting the organization’s ability to identify and seed new growth opportunities in emerging markets or technologies before competitors do.
5. The Challenge of Sustaining Revenue Growth
Finally, the book highlights that sustaining high revenue growth is far more difficult than sustaining high ROIC. High growth rates decay extremely rapidly, typically converging toward the average rate of the broader economy (below 5% in real terms) within five to ten years. This rapid decay is driven by two factors:
- The S-Curve Product Life Cycle: All individual product markets eventually reach saturation, where sales growth slows to match population or economic growth.
- The “Portfolio Treadmill” Effect: As a company expands in size, maintaining a constant high growth rate requires the continuous launch of progressively larger new product categories or geographic entries just to keep pace.
Competitive Advantage
In the book, the concept of competitive advantage is defined as the core engine that powers a company’s financial value drivers. While high-level financial metrics like Return on Invested Capital (ROIC) and revenue growth are the primary quantitative drivers of corporate value, they are ultimately only the financial reflections of a company’s underlying competitive advantage.
Without a well-defined and sustainable competitive advantage, competition will inevitably erode supernormal returns, forcing a company’s ROIC back down toward its cost of capital.
1. The Operational Link: Translating Strategy to Unit Economics
To connect strategy directly to the financial value drivers, the book disassembles ROIC into a unit-level equation:

To generate a higher ROIC, a company must possess a competitive advantage that allows it to either charge a price premium or operate with superior cost and capital efficiency (or both). The book identifies ten distinct sources of competitive advantage, categorized by how they influence these operational drivers:
A. Price Premium Advantages
These advantages allow a firm to command higher prices than competitors without losing proportionate volume, directly boosting operating margins:
- Innovative Products: Patented or difficult-to-copy technologies or services (such as patent-protected pharmaceutical drugs).
- Quality: Real or perceived differences in product reliability, performance, or durability for which customers are willing to pay more (e.g., BMW or Weber appliances).
- Brand: Strong emotional or historical customer loyalty that commands a premium even if there is no objective quality difference (e.g., Coca-Cola or Perrier).
- Customer Lock-In: Situations where switching to a competitor is too costly or troublesome for the buyer (such as medical devices that doctors have trained extensively to use, or Gillette’s razor-and-blade model).
- Rational Price Discipline: Industry-wide capacity management or price signaling led by a dominant competitor in highly consolidated markets (such as the post-consolidation U.S. airline industry).
B. Cost and Capital Efficiency Advantages
These advantages allow a company to produce and distribute its offerings at a lower unit cost or with less capital per unit than rivals:
- Innovative Business Methods: Structural re-engineering of the traditional industry value chain that is difficult for incumbents to copy without disrupting their existing models (e.g., IKEA’s flat-pack, self-assembly model or Dell’s early direct-to-consumer assembly).
- Unique Resources: Geographically advantaged or structurally superior access to raw materials that cannot be replicated (e.g., Nornickel’s palladium-rich Siberian mines or shallow North American gold deposits).
- Economies of Scale: Local or regional dominance that spreads fixed operational and advertising costs over high volume, creating a barrier that subscale competitors cannot match (e.g., local market share dominance for healthcare insurers or UPS’s capital-intensive global shipping network).
- Scalable Products or Processes: Utilizing technology to serve incremental customers at near-zero marginal cost (such as standardized software platforms or media streaming).
C. The Dual Advantage: Network Economies
- Network Economies (Increasing Returns to Scale): This is the ultimate competitive advantage, combining both price premium and capital efficiency. As a scalable platform gains users, the product becomes more valuable to existing customers while unit costs continue to drop. The book contrasts eBay’s highly successful, capital-light platform model—which exhibited massive network economies—with Webvan’s failed, highly capital-intensive online grocery model that lacked scale economies and collapsed.
2. Sustaining Value Over Time (Mean Reversion)
A critical dimension of corporate valuation is determining how long a company can maintain its competitive advantage. In a perfectly competitive economy, high ROICs are competed away as rivals enter the market.
However, the book’s empirical analysis reveals that both high- and low-performing companies demonstrate remarkable stability over ten-year horizons. A company with an ROIC above 25% has a 70% probability of remaining a high-return leader a decade later. This persistence exists because top-performing companies are uniquely capable of defending their core competitive advantages and leveraging their capabilities to successfully renew their product pipelines.
3. The “Pecking Order” of Value-Creating Growth
The durability of a company’s competitive advantage also dictates how growth impacts value. Expanding via organic new-product development sits at the top of the value-creation hierarchy because it leverages a company’s existing competitive advantages (like proprietary R&D, brand equity, and established distribution systems) with very little incremental capital. Conversely, growth via acquisitions sits at the bottom of the pecking order because buyers must pay a heavy control premium to the target’s shareholders, which typically transfers the bulk of the transaction’s economic value away from the acquirer.
Market Context
The book establishes that managers must understand how the market context interacts with the core principles of corporate finance, separating this relationship into the real market and the financial (or capital) market. In the real market, value is created by generating cash flows and earning a return on invested capital (ROIC) that exceeds the opportunity cost of capital. The rule here is strictly economic: select strategies and make operational choices that maximize the present value of future cash flows or future economic profits. In contrast, the financial market sets stock prices based on what investors think those shares are worth, which represents their expectations of future performance rather than past results or the cost of assets.
The Expectations Treadmill
- Performance vs. Expectations: The return that shareholders actually earn is driven by changes in the market’s expectations rather than the standalone performance of the company. If a company performs exactly as the market expects, its shareholders will earn a return equal only to their opportunity cost of capital (the discount rate). Shareholders earn superior returns only if the company outperforms expectations, and they earn lower returns if performance falls short of those expectations.
- The Treadmill Analogy: The book compares this dynamic to a treadmill, where the speed represents the expectations built into a company’s share price. When a company beats expectations, its stock price rises, but this also quickens the speed of the treadmill because the higher price now embeds even higher expectations for future performance. Consequently, managers must perform even better just to keep the stock price stable, making it virtually impossible to continuously beat the market over extended periods. This means that a good company and a good investment are not always the same in the short term, as future exceptional performance may already be priced into the stock. Managers must therefore balance maximizing intrinsic value in the real market and managing expectations in the financial market.
Market Dynamics: Informed Investors vs. Noise Traders
To explain how a volatile market produces rational prices most of the time, the book outlines a model of market trading boundaries consisting of two investor groups:
- Informed (Fundamental) Investors: These investors buy and sell shares based on a calculated view of a company’s intrinsic value, which they derive from fundamental economic factors like ROIC and growth.
- Noise Traders: These traders have no view on intrinsic value and instead trade on momentum, near-term news, or random, insignificant events.
- Trading Boundaries: The trading of noise traders creates price volatility, but informed investors establish upper and lower trading boundaries that keep stock prices oscillating within a fundamental band. Although noise traders can temporarily push prices away from fundamentals—occasionally causing valuation bubbles like the late-1990s technology boom—fundamental economics eventually prevail and align stock prices with intrinsic value.
Market Efficiency and the Primacy of Fundamentals
The book argues that the stock market is smarter than most managers think and relies strictly on fundamental economics over the long run. Sophisticated investors look past reported accounting information to understand the underlying cash flows.
- Accounting Gimmicks: Well-functioning capital markets are not easily fooled by paper transactions or accounting adjustments that do not alter cash flows. For example, stock prices did not drop when option expensing became mandatory in 2004, nor did they change when goodwill amortization was eliminated in 2002, because investors had already factored these costs into their valuations using footnotes long before the accounting changes occurred.
- Asset Write-Downs: Large asset write-downs (such as goodwill impairments) do not trigger significant drops in share prices on the day of announcement because the market anticipates the diminished value and adjusts stock prices long before the accounting write-off takes place.
- Earnings Volatility and Smoothing: Many executives believe investors pay a premium for steady, smooth earnings growth and will go to great lengths to stabilize reported profits. However, earnings volatility has little to no impact on market value or shareholder returns, and smooth earnings growth is largely a myth. Investors see through artificial smoothing and focus instead on cash flow volatility.
Refuting Structural Market Myths
In managing corporate value, executives often pursue financial strategies based on market misconceptions, which the book refutes using empirical evidence:
- The Conglomerate Discount: Many believe that capital markets automatically discount diversified companies. However, when sum-of-the-parts calculations are conducted using true comparable industry peers, the conglomerate discount disappears, proving that any lower valuation is a performance discount due to underperforming business units, not a penalty for diversification.
- Company Size: There is no evidence that absolute size brings valuation premiums or lowers the cost of capital once a company has reached a modest market capitalization of $250 million to $500 million.
- Index Membership and Listings: While managers believe that S&P 500 index inclusion, cross-listing on foreign exchanges, or stock splits permanently raise valuations, data show these effects are either nonexistent or strictly temporary.
- Value Distribution: Dividends and share repurchases do not create value, as they are merely instruments for distributing already-generated cash. Positive stock reactions to payout announcements reflect changed expectations—either because the payout signals capital discipline or because it indicates management’s confidence in future cash flows.
Investor Segmentation and Price Setting
To navigate this market context successfully, the book advises managers to segment institutional investors by their investment strategies:
- Traders: Seek short-term profits by betting on near-term price movements and events, trading in and out of stocks quickly. They generate high transaction volumes but have a minor impact on long-term prices.
- Intrinsic Investors: Undertake rigorous due diligence on a company’s ability to create long-term value, hold concentrated portfolios, and have low turnover.
- Price Drivers: Although traders dominate daily news, intrinsic investors are the ultimate drivers of stock prices in the long run. Because they manage large blocks of capital and trade in massive, concentrated blocks, their actions align market prices with intrinsic value over time. Therefore, the book strongly recommends that corporate leaders focus their communication, transparency, and strategic disclosure efforts on intrinsic investors.
Shareholder Expectations Treadmill
According to the book, the shareholder expectations treadmill is a critical market dynamic that explains why a company’s stock market performance—measured by Total Shareholder Returns (TSR)—often diverges from its actual operating and intrinsic value creation.
Within the larger market context, this treadmill exists because of a fundamental reality: investors price a company’s shares based on the future performance they expect the company to achieve, not what it has achieved in the past.
How the Expectations Treadmill Works
The speed of the treadmill represents the expectations embedded in a company’s share price.
- The Acceleration Effect: When a company outperforms expectations, its stock price rises to capitalize on that incremental improvement. However, this success instantly quickens the speed of the treadmill because the higher price now embeds even higher expectations.
- The High-Performer Predicament: To keep the stock price rising, or even stable, managers must run faster and deliver even higher levels of performance. This means that extraordinary managers leading highly successful companies often deliver only ordinary TSR because their stellar performance is already anticipated and priced in.
- The Low-Performer Advantage: Conversely, a company starting with low expectations of success has a much slower, easier ride on the treadmill, making those low expectations far easier to beat.
Because of this treadmill effect, a great company and a great investment are not always the same in the short term.
Key Illustrative Cases from the Book
The book details several real-world and conceptual scenarios to highlight how the expectations treadmill dictates market valuations and corporate behavior:
1. Tyson Foods vs. J&J Snack Foods (2013–2017)
J&J Snack Foods was smaller, grew faster (6% vs. 3%), and had a superior Return on Invested Capital (ROIC) (24% vs. 19%) compared to Tyson Foods. Yet, Tyson’s shareholders earned nearly twice the annualized TSR (27% vs. 14%). This mismatch was driven by the expectations treadmill: J&J began the period with high expectations (an EV/NOPAT multiple of 23 times), meaning its treadmill was already running very fast. Tyson started with a modest multiple of 13 times, allowing its managers a much easier ride to outperform market expectations and generate a higher TSR.
2. Terry Turnaround (The Fictional CEO)
When Terry takes over a low-performing company (Prospectus), expectations and valuations are low. As she successfully turns the company around, the stock price rises rapidly because the market did not expect the improvement. However, once Prospectus becomes the industry leader, the market expects continued top-tier performance. Terry finds that even though she maintains excellent operations, the company’s share price now performs no better than its peers because its high-performance trajectory is already locked into the stock price.
3. Home Depot (1999)
At the end of 1999, Home Depot’s massive market value and earnings multiple of 47 meant that the company had to grow its revenues by 26% annually for the next 15 years just to maintain its 1999 share price. While Home Depot went on to deliver a highly respectable 13% average annual revenue growth through 2006, it fell far short of the treadmill’s mathematically impossible expectations, causing its shares to underperform the S&P 500 by 8% per year.
4. Mirant (2000)
Spun off at an extraordinary multiple of 30 times EBITA, Mirant’s management felt intense pressure from the expectations treadmill to justify its high stock price. This pressure pushed them to expand aggressively and accumulate a massive debt burden to fund global projects. When these high-risk bets failed, the company fell into bankruptcy, illustrating the dangerous corporate behaviors the treadmill can incentivize.
Navigating the Treadmill: Implications for Managers
Because capital markets are highly efficient but not omniscient, managers must carefully distinguish between managing operations in the “real market” and managing expectations in the “financial market”:
- Incentives and Compensation: The book warns that using short-term TSR in isolation is a flawed basis for executive compensation because the majority of short-term TSR is driven by market-wide factors (like interest rates and inflation) and changes in investor expectations rather than actual managerial performance. Instead, compensation should be tied to growth, ROIC, and TSR performance relative to peers.
- Reverse Engineering the Share Price: To determine where they sit on the treadmill, managers should use discounted-cash-flow (DCF) models to “reverse engineer” their current share price. This quantifies the exact revenue growth rate and ROIC that the market expects, helping managers assess their strategic plans and spot any expectation gaps before making major strategic moves.
Ultimately, understanding the expectations treadmill gives boards and management teams the courage to focus on long-term value-creating priorities rather than chasing short-term, illusory share price bumps.
Market Fundamentals vs. Myths
In the larger context of the market context, the book establishes that while the stock market can be volatile in the short term, over the long run, it is highly rational and tracks fundamental economic drivers—namely, Return on Invested Capital (ROIC) and revenue growth.
To explain this dynamic, the book models the stock market as an arena bounded by two types of traders: informed (fundamental) investors who buy and sell based on intrinsic value derived from cash flows, and noise traders who transact on near-term news or price momentum. Although noise traders create short-term price volatility, informed investors act as the ultimate price setters, establishing trading boundaries that pull stock prices back into alignment with economic reality.
Despite this fundamental grounding, corporate executives frequently make strategic decisions based on widespread market misconceptions. The book systematically deconstructs these myths by contrasting them with market realities:
1. Myths about Earnings and EPS Management
- The Myth: Managers often believe that Earnings Per Share (EPS) is the ultimate driver of corporate value and that the market will reward any action that boosts reported EPS, such as share buybacks or EPS-accretive acquisitions.
- The Fundamental Reality: Earnings do not drive value in their own right; only operating cash flows do. Shifting the appearance of earnings without changing underlying cash flows is value-neutral under the conservation of value principle. For example, when a company borrows money to repurchase shares and artificially boost EPS, the transaction increases financial leverage and risk, which drives down the company’s price-to-earnings (P/E) multiple and leaves the stock price unchanged. Similarly, acquisitions only create value if they generate tangible operating improvements that exceed the premium paid, regardless of whether the transaction is immediately accretive to EPS.
2. Myths about Earnings Volatility and Guidance
- The Myth: Executives often assume investors will pay a valuation premium for smooth, predictable earnings growth, and that providing regular earnings guidance lowers share price volatility and increases stock liquidity.
- The Fundamental Reality: Smooth earnings growth is largely a myth, as almost no mature company demonstrates uninterrupted steady growth over a decade. Empirical evidence shows that earnings volatility has little to no impact on market value or shareholder returns, as sophisticated investors look past accounting smoothing to evaluate cash flow volatility. Furthermore, providing quarterly or annual EPS guidance does not affect a company’s earnings multiples or long-term share price volatility. In fact, it often introduces hidden costs by tempting managers to cut long-term, value-creating expenditures (like R&D) to meet artificial short-term consensus targets.
3. Myths about Accounting Changes and Write-Downs
- The Myth: Managers worry that noncash charges, such as goodwill impairments (write-downs) or accounting changes (such as mandatory expensing of employee stock options), will spook investors and depress stock prices.
- The Fundamental Reality: Stock markets focus on fundamental cash flows, not accounting presentation. When companies announced massive goodwill write-offs of $2 billion or more, there was no statistically significant drop in their share prices on the announcement day because the market had already anticipated the economic loss and adjusted the stock price months in advance. Similarly, when the FASB mandated option expensing in 2004, stock prices did not drop because the dilutive impact of options had already been factored in by sophisticated investors using footnote disclosures.
4. Myths about Diversification and the “Conglomerate Discount”
- The Myth: Executives believe that diversification lowers a company’s risk, increases its debt capacity, and that the stock market applies an automatic “conglomerate discount” to diversified portfolios simply because of their structure.
- The Fundamental Reality: Diversification provides no tangible risk or tax benefits in developed economies, and it often destroys value by adding complexity and bureaucracy. In addition, the book notes that the so-called conglomerate discount is a mathematical illusion. When sum-of-the-parts calculations are conducted using true comparable industry peers rather than broad industry averages, the conglomerate discount disappears. Any lower valuation is a performance discount due to underperforming business units, not a penalty for diversification.
5. Myths about Company Size
- The Myth: Many corporate leaders assume that the absolute size or scale of a company lowers its cost of capital and automatically improves operational performance.
- The Fundamental Reality: Beyond a modest market capitalization threshold of $250 million to $500 million, company size has no impact on relative market valuation or the cost of capital. Furthermore, economies of scale are typically local or regional rather than national or global, and expanding size simply to get larger often generates complexity, extends the chain of command, and increases operational costs.
6. Myths about Market Mechanics (Index Inclusion, Cross-Listing, and Splits)
- The Myth: Conventional wisdom suggests that companies can secure permanent valuation premiums by getting included in leading indexes (like the S&P 500), cross-listing on prestigious global exchanges, or splitting their stock.
- The Fundamental Reality: These mechanical shifts have no impact on long-term value:
- Index Inclusion: While index inclusion initially drives a short-lived share price increase as index-tracking funds rebalance their portfolios, the effect is fully reversed, and all price anomalies disappear within 45 days.
- Cross-Listing: For companies already based in mature, developed markets, cross-listing on foreign exchanges does not lower the cost of capital, increase liquidity, or expand analyst coverage.
- Stock Splits: Splits are purely aesthetic transactions that do not alter the cash flow pie. Any positive three-day abnormal return around a split announcement is merely a signaling effect, as splits indicate management’s confidence in strong future earnings growth.
7. Myths about Value Distribution
- The Myth: Many executives and shareholders believe that issuing dividends or executing share repurchases directly creates wealth for investors.
- The Fundamental Reality: Value is created when a company invests capital at a return that exceeds its cost of capital to generate cash flows. Distributing that cash through dividends or repurchases merely alters the form of payment and cannot create additional value. While share prices often react positively to payout announcements, this is entirely a signaling effect—reflecting investor relief over capital discipline or management’s confidence in future cash flow generation.
ESG and Digital Initiatives
In the book, environmental, social, and governance (ESG) concerns and digital transformations are identified as two of the most critical yet “slippery” items on the modern corporate agenda. While many executives view these initiatives as unquantifiable or purely “strategic” necessities, the book establishes that valuing ESG and digital strategies follows the exact same universal economic principles that apply to all other investment decisions: discounted cash flows (DCF) comparing scenario-based cash flows against a realistic base case.
Within the larger market and valuation context, these initiatives are not merely ethical or technological options; they are fundamental drivers of a company’s long-term cash flows, Return on Invested Capital (ROIC), and risk profile.
1. The Analytical Bridge: The “Eroding” Base Case
A common logic error made by executives when evaluating both digital and ESG investments is defining the “do-nothing” base case as a flat line where current profits and cash flows remain completely stable.
The book argues that in a dynamic, competitive market, the business-as-usual or do-nothing case is almost always an eroding line.
- The Digital Reality: For example, when a bank invests in a mobile-banking app, the app may not generate brand-new revenues because customers have come to expect it. On a standard, flat base-case analysis, the investment would appear to have a negative net present value (NPV) due to its upfront cost and lack of incremental revenue. However, if the bank does nothing, its market share and profits will inevitably decline as customers migrate to tech-forward competitors. Comparing the digital investment against this eroding base case reveals that the investment actually has a highly positive NPV because it maintains competitive parity and prevents decay.
- The ESG Reality: Similarly, choosing to wait out investments in resource-efficient or low-carbon technologies is often the most expensive option. Relying on energy-hungry, carbon-intensive plants is a decaying path as shifting regulatory landscapes (such as diesel bans or carbon taxes) and evolving consumer preferences systematically drain cash over time.
2. How ESG Propels Intrinsic Value
Rather than acting as a drag on performance, a strong ESG proposition systematically safeguards a company’s long-term value and reduces its downside risk, which capital markets reward with lower loan spreads and higher credit ratings. This relationship is driven by a massive influx of capital—sustainable investment funds topped $30 trillion globally in 2018—and the reality that 83% of surveyed executives would pay a premium to acquire a company with a positive ESG reputation.
The book outlines five specific pathways where a strong ESG proposition links directly to cash flows and intrinsic value:
- Facilitating Revenue Growth: Gaining trust from governing authorities helps companies secure licenses and approvals to tap new markets. It also drives customer preference; research shows that over 70% of consumers are willing to pay a premium (typically around 5%) for green products.
- Reducing Costs: Proactive resource efficiency in energy, water, and waste directly lowers operating expenses and boosts profits (such as 3M’s “pollution prevention pays” program, which has saved the company $2.2 billion since 1975).
- Minimizing Regulatory and Legal Interventions: Typically, one-third of corporate profits are at risk from state intervention (rising to 50–60% in highly regulated sectors like banking and aerospace). A strong external-value proposition drastically lowers the risk of adverse government actions, fines, or operational delays.
- Uplifting Employee Productivity: Corporate purpose and positive social impact enhance employee retention, motivation, and satisfaction. Notably, companies on Fortune’s “100 Best Companies to Work For” list generated 2.3% to 3.8% higher stock returns per year than their peers over a 25-year period.
- Optimizing Investment and Capital Expenditures: Forward-looking ESG planning prevents companies from sinking capital into “stranded assets” (such as fossil-fuel equipment that may be banned or heavily taxed before the end of its useful life).
3. How Digital Initiatives Power the Value-Creation Engine
Digital initiatives create value by either improving a company’s existing operations or completely upending industry structures to introduce disruptive business models.
- Operational Improvements (Doing Existing Things Better):
- Cost Reduction: Technologies like robotic process automation (RBA) and predictive maintenance systematically lower cost bases. However, the book warns of second-order competitive effects. In commodity-like, highly competitive markets (such as chemicals), cost-saving innovations are quickly copied and passed directly to consumers as price cuts, meaning margins do not structurally expand. The investment remains necessary, however, to avoid falling below the eroding competitive threshold.
- Customer Experience and Analytics: Omnichannel retail structures protect market share, while data-driven pricing and advanced analytics (such as automated shelf-space planograms) optimize product mix and increase average basket sizes.
- Disruptive Models and the “Network Effect” Fallacy:
- To value highly disruptive, fast-growing digital models (such as cloud computing or streaming platforms), the book advises starting in the future at a point of market stabilization to estimate revenues and ROIC, and then working backward to current performance.
- Many digital start-ups claim to possess network effects (increasing returns to scale), where the product becomes more valuable to existing users with every new customer, enabling the leader to capture a “winner-take-all” monopoly (e.g., eBay or Microsoft Office).
- However, the book strongly warns that true network effects are exceedingly rare. During market bubbles (such as the dot-com boom or the modern “unicorn” era), investors frequently overvalue companies that rent office space or sell consumer products on the false assumption of network economies, only to face massive capital losses when these models fail to deliver sustainable returns.
4. Reconciling Market Pressures with Long-Term Strategy
The biggest threat to successful ESG and digital execution is corporate short-termism. Because of information asymmetry—where public investors do not know as much about a company’s internal decisions as managers do—executives are often tempted to “pump up” short-term earnings and meet analyst consensus estimates.
To hit these immediate numbers, fully 80% of surveyed CFOs admitted they would cut back on discretionary, value-creating expenditures like product development, R&D, and brand building. This behavior destroys long-term value, as skimping on safety, employee welfare, or digital upgrades eventually triggers operational decay, customer backlash, and reputational crises.
Fortunately, the book emphasizes that the stock market is smarter than most managers think; in the long run, stock prices track fundamental ROIC and growth.
- Short-term price fluctuations are often dominated by “noise traders” who react to near-term headlines.
- However, long-term stock prices are ultimately driven by “intrinsic investors”—sophisticated institutional managers who run highly concentrated portfolios and make long-term fundamental bets.
- Survey data reveals that intrinsic investors overwhelmingly support long-term ESG and digital initiatives, even if they lead to short-term earnings misses or require painful restructuring write-downs, as long as the strategic roadmap is transparently communicated. They want management to “educate” them on competitive advantage rather than sugarcoat short-term results to meet artificial quarterly consensus targets.
By applying a disciplined scenario-based DCF approach to both ESG and digital investments, companies can align their operational decisions with long-term value, secure the backing of intrinsic investors, and successfully navigate the expectations treadmill of the public markets.
— Linden Lake
This series:
→ Book Review (1 of 5): Valuation – Foundations of Value
→ Book Review (2 of 5): Valuation – Core valuation Techniques
→ Book Review (3 of 5): Valuation – Advanced Valuation Techniques
→ Book Review (4 of 5): Valuation – Managing for Value
→ Book Review (5 of 5): Valuation – Special Situations
Leave a Reply