
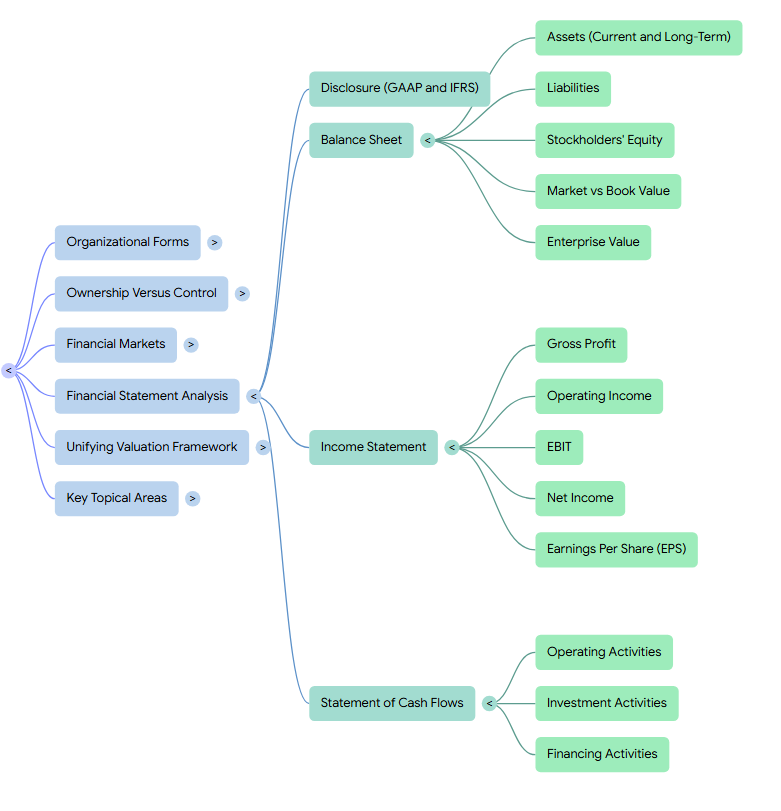
In the study of corporate finance, financial statement analysis is presented as the primary tool for communicating a firm’s past performance to the investment community and providing essential data for internal decision-making. Public companies are required to file these standardized reports—usually 10-K annual and 10-Q quarterly filings—with the SEC to ensure transparency and comparability across the market.
The Core Financial Statements
According to corporate finance, a comprehensive analysis begins with four mandatory reports:
- The Balance Sheet: This provides a “snapshot” of the firm’s financial position at a specific point in time, listing assets, liabilities, and stockholders’ equity. A critical distinction is made between book value, which records historical costs, and market value (market capitalization), which reflects what investors expect those assets to produce in the future.
- The Income Statement: This report lists revenues and expenses over a period to determine net income, often referred to as the firm’s “bottom line” or earnings.
- The Statement of Cash Flows: Because net income does not always correspond to actual cash generated, this statement tracks how cash was provided or used through operating, investing, and financing activities.
- The Statement of Stockholders’ Equity: This breaks down equity into amounts from share issuances versus retained earnings.
Financial Ratio Analysis
The sources emphasize using financial ratios to evaluate a firm’s performance over time or against industry peers. Key categories include:
- Profitability Ratios: These include the gross margin, operating margin, and net profit margin, which measure the fraction of each dollar of sales that remains after various costs are deducted.
- Liquidity Ratios: Measures such as the current ratio, quick ratio, and cash ratio assess a firm’s ability to meet its short-term obligations using its most liquid assets.
- Working Capital Ratios: Ratios like accounts receivable days, inventory days, and turnover ratios indicate how efficiently a firm manages its operational cycle and turns sales into cash.
- Interest Coverage Ratios: Lenders use EBIT/Interest or EBITDA/Interest multiples to gauge a company’s ability to pay the interest on its debt.
- Leverage Ratios: These measure the extent to which a firm relies on debt, using metrics such as the debt-equity ratio, net debt, and the equity multiplier.
- Valuation Ratios: The price-earnings (P/E) ratio and enterprise value multiples (e.g., EV-to-EBITDA) allow investors to gauge if a stock is fairly priced relative to its fundamentals.
Performance Metrics and the DuPont Identity
The sources introduce several measures of operating returns, most notably Return on Equity (ROE), Return on Assets (ROA), and Return on Invested Capital (ROIC). To provide deeper insight into ROE, corporate finance utilizes the DuPont Identity, which decomposes the return into three components: net profit margin (profitability), asset turnover (efficiency), and the equity multiplier (leverage).
Furthermore, some sources advocate for Economic Value Added (EVA) or residual income as a superior measure of performance. Unlike traditional accounting profit, EVA determines if a firm has earned a return above its actual cost of capital, thus truly creating value for shareholders.
Regulatory Environment and Governance
The integrity of financial statement analysis relies on Generally Accepted Accounting Principles (GAAP) and the oversight of neutral third-party auditors. In the larger context of corporate finance, historical scandals—such as Enron and WorldCom—led to significant legislative reforms like the Sarbanes-Oxley Act (SOX) and the Dodd-Frank Act, which increased penalties for fraud and tightened disclosure procedures. These regulations ensure that the “snapshot” provided to the market remains a reliable basis for valuation.
Disclosure (GAAP and IFRS)
In corporate finance, disclosure via financial statements is the primary method by which public companies communicate their past performance to the investment community and provide the data necessary for internal decision-making. In the United States, these periodic reports are filed with the Securities and Exchange Commission (SEC) on forms 10-K (annually) and 10-Q (quarterly).
Generally Accepted Accounting Principles (GAAP)
To ensure that financial disclosures are understandable and accurate, public companies must follow Generally Accepted Accounting Principles (GAAP).
- Standardization: GAAP provides a common set of rules and a standard format, which is essential for analysts to compare the financial results of different firms.
- Auditing: To provide investors with assurance of accuracy, corporations must hire a neutral third-party auditor to verify that the statements are reliable and prepared according to GAAP.
- Integrity: Historical reporting abuses, such as those at Enron and WorldCom, led to the Sarbanes-Oxley Act (SOX), which stiffened penalties for providing false information and forced companies to validate their internal financial control processes.
International Financial Reporting Standards (IFRS)
As capital markets have become more global, the interest in harmonizing accounting standards led to the creation of the International Financial Reporting Standards (IFRS), issued by the International Accounting Standards Board (IASB).
- Global Adoption: As of 2022, over 165 jurisdictions require or permit the use of IFRS, including the European Union, Australia, Canada, Japan, and Singapore.
- GAAP vs. IFRS: The main difference is conceptual: U.S. GAAP is based primarily on specific accounting rules, whereas IFRS is based on broader principles that require more professional judgment by accountants.
- Valuation Differences: GAAP relies more heavily on historical cost to estimate the value of assets, while IFRS allows for the revaluation of certain non-financial assets to “fair value”.
- Convergence: While the Sarbanes-Oxley Act spurred efforts to bring the two standards closer together, key differences remain in the treatment of inventory valuation, R&D expenses, and financial instruments.
Disclosure in the Context of Analysis
Within the larger framework of financial statement analysis, these disclosure standards provide the necessary “snapshot” for evaluating a firm’s health.
- Comparability: Standardization through GAAP and IFRS allows investors to evaluate a firm by comparing it to its own historical performance or to a peer group of similar companies using financial ratios.
- Qualitative Context: A comprehensive analysis requires looking beyond the numbers to other disclosed information, such as the Management Discussion and Analysis (MD&A), where management outlines risks and future plans.
- Note Interpretation: Companies provide extensive notes to the financial statements that document accounting assumptions, debt schedules, and off-balance sheet transactions, all of which are vital for a full interpretation of the firm’s value.
Ultimately, corporate finance emphasizes that the reliability of financial statement analysis depends on the transparency of these disclosures and the reputation of the auditors who certify them.
Balance Sheet
In corporate finance, the balance sheet (also referred to as the statement of financial position) is defined as a snapshot of a firm’s financial position at a specific point in time. It is structured around the fundamental balance sheet identity: Assets = Liabilities + Stockholders’ Equity. This report serves as a primary tool for communicating performance to investors and provides the necessary data for internal decision-making.
Structure and Components
The balance sheet is divided into two sides that must always balance:
- Assets (Left Side): These represent the investments the company has made and are typically listed in declining order of liquidity. Current assets are those expected to be converted to cash within one year, such as cash, marketable securities, accounts receivable, and inventories. Long-term assets include tangible fixed assets like property, plant, and equipment (PPE), which are recorded at historical cost less accumulated depreciation, as well as intangible assets like goodwill, patents, and brand names.
- Liabilities and Equity (Right Side): These summarize the firm’s sources of capital. Current liabilities must be satisfied within one year and include accounts payable and short-term debt. Long-term liabilities consist of obligations like long-term debt, leases, and deferred taxes. Stockholders’ equity is the residual claim on the firm’s assets after all liabilities are met; it is often called the book value of equity.
Role in Financial Analysis
Within the larger context of financial statement analysis, the balance sheet provides several key metrics and benchmarks:
- Net Working Capital: Computed as current assets minus current liabilities, this represents the capital available in the short term to run the business.
- Book Value versus Market Value: Analysts distinguish between the book value (historical cost) and the market value (market capitalization). Market value depends on what investors expect assets to produce in the future and is calculated as the share price multiplied by the number of shares outstanding.
- Enterprise Value: This measures the total value of the underlying business operations, calculated as the market value of equity plus debt, minus cash.
- Ratio Analysis: The balance sheet is essential for calculating liquidity ratios (like the current and quick ratios) to assess solvency, and leverage ratios (like the debt-equity ratio) to measure the firm’s reliance on debt.
- The DuPont Identity: This analytical tool uses balance sheet data (Total Assets and Book Value of Equity) alongside income statement figures to decompose Return on Equity (ROE) into components of profitability, asset efficiency, and leverage.
Limitations of the Balance Sheet
The sources emphasize that the balance sheet may not capture the “true” value of a firm for several reasons:
- Historical Cost Bias: Assets are recorded at their acquisition cost, which may differ significantly from their current market value.
- Missing Intangibles: Many valuable assets—such as employee expertise, corporate culture, customer relationships, and reputation—are often excluded from the balance sheet unless they were part of an acquisition.
- Accounting Assumptions: Factors like the chosen depreciation method or the write-off of R&D as a current expense rather than an investment can distort the reported values.
- Share Repurchases: Active stock buyback programs can reduce book equity to near-zero or negative levels, making ratios that use book value in the denominator difficult to interpret.
Assets (Current and Long-Term)
In the study of corporate finance, the balance sheet provides a “snapshot” of a firm’s financial position, with assets listed on the left side to show how the company has invested its capital. Assets are categorized as either current or long-term and are typically listed in declining order of liquidity.
Current Assets
Current assets are defined as cash or other assets that a firm expects to convert into cash within one year. Within the framework of corporate finance, these assets represent the firm’s most liquid resources and include several key components:
- Cash and Marketable Securities: This category includes actual currency and short-term, low-risk investments that can be easily sold, such as government debt maturing within a year.
- Accounts Receivable: These represent amounts owed to the corporation by customers who purchased goods or services on credit.
- Inventories: This includes raw materials, work-in-progress, and finished goods awaiting sale.
- Other Current Assets: This is a catch-all category for items like prepaid expenses, such as rent or insurance paid in advance.
The difference between these current assets and current liabilities is known as net working capital, which serves as a measure of the company’s potential reservoir of cash to meet short-term needs.
Long-Term Assets
Long-term assets are those intended to produce tangible benefits for more than one year. Corporate finance distinguishes between two primary types:
- Tangible Fixed Assets: Often referred to as Property, Plant, and Equipment (PPE), these include real estate, buildings, and machinery. These assets are generally illiquid and are recorded at their historical acquisition cost.
- Intangible Assets: These lack physical substance but provide value through things like patents, trademarks, brand names, and “know-how”. A specific type of intangible asset, goodwill, is recorded when a firm pays more for an acquisition than the book value of the acquired tangible assets.
Valuation and Accounting Mechanics
A central theme in corporate finance is how these assets are valued on the balance sheet.
- Depreciation and Amortization: Because tangible long-term assets wear out or become obsolete, firms deduct a fraction of their cost each year as a non-cash depreciation expense. The “book value” of an asset is its original cost minus this accumulated depreciation. Similarly, the value of acquired intangible assets may be reduced over time through amortization or impairment charges.
- Historical Cost vs. Market Value: The balance sheet typically reflects historical costs, which may differ significantly from the “true” market value. Market value, or market capitalization, depends on what investors expect those assets to produce in the future rather than what was paid for them years ago.
- Missing Assets: Many of a firm’s most valuable assets—such as employee expertise, corporate culture, and the quality of the management team—are often not captured on the balance sheet at all.
Ultimately, while the balance sheet must always satisfy the identity where Assets = Liabilities + Stockholders’ Equity, corporate finance emphasizes that the accounting net worth of a firm (book value) is often an inaccurate assessment of its actual market value due to these valuation conventions and excluded intangible factors.
Liabilities
In corporate finance, liabilities are defined as the firm’s obligations to its creditors. They are a fundamental component of the balance sheet, which is structured around the identity that Assets = Liabilities + Stockholders’ Equity. This report provides a “snapshot” of a firm’s financial position, showing how its assets were financed through either borrowing (liabilities) or internal funds and share sales (equity).
Classification of Liabilities
Liabilities are categorized on the balance sheet based on the timeline for their repayment:
- Current Liabilities: These are obligations that a firm expects to satisfy within one year. Major components include accounts payable, which are amounts owed to suppliers for credit purchases, and short-term debt or notes payable. This category also includes the “current maturities” of long-term debt—the portion of a larger loan that is due within the next 12 months. Other items include accruals for unpaid salaries or taxes and unearned revenue for products that have been paid for but not yet delivered.
- Long-Term Liabilities: These consist of obligations extending beyond one year. The primary example is long-term debt, which corporations issue to raise capital for major investments. Other significant long-term liabilities include leases and deferred taxes.
Debt-Equivalent and “Hidden” Liabilities
The sources highlight that some liabilities are not always straightforward and may be considered debt-equivalent obligations:
- Leases: Historically, “operating leases” were kept off the balance sheet, but modern accounting rules implemented in 2019 now require most long-term leases to be listed as both a right-of-use asset and a corresponding lease liability. Finance leases have long been treated as acquisitions for accounting purposes, with the present value of future payments listed as a liability.
- Pension and Health Obligations: Unfunded pension liabilities and postretirement health benefits are massive, fixed long-term obligations that carry significant financial risk, even if they are sometimes disclosed in the notes rather than as debt on the main balance sheet.
- Deferred Taxes: These liabilities arise when a company’s financial income exceeds its income for tax purposes, often due to differences in depreciation methods. While they appear as a liability, they are not a security held by investors but rather an accounting entry representing taxes that will eventually be paid.
Seniority and Security
Within the structure of corporate debt, liabilities are further defined by their legal priority and backing:
- Secured vs. Unsecured: Secured debt, such as mortgage bonds, is backed by specific collateral (like property or equipment) that creditors can seize in default. Unsecured debt, known as debentures or notes, represents a general claim against the firm’s unpledged assets.
- Seniority: In the event of bankruptcy, a bond’s seniority determines its claim order. Subordinated debentures have lower priority and are only paid after more senior debt holders have been satisfied.
Role in Financial Analysis
Liabilities are critical for assessing a firm’s risk and efficiency. The difference between current assets and current liabilities is known as net working capital, a measure of short-term solvency. Analysts also utilize leverage ratios, such as the debt-equity ratio, to determine the extent to which a firm relies on debt as a source of financing, which in turn impacts the volatility and required return of its stock.
Stockholders’ Equity
In corporate finance, stockholders’ equity is defined as the accounting measure of a firm’s net worth, representing the difference between the total value of its assets and its total liabilities. It is a core component of the fundamental balance sheet identity, which states that Assets = Liabilities + Stockholders’ Equity. While liabilities represent obligations to creditors, equity represents the residual claim on the firm’s assets and cash flows after those obligations have been met.
Components and Composition
Stockholders’ equity is primarily composed of two parts: capital contributed by investors and earnings retained by the firm.
- Contributed Capital: This includes the proceeds from the sale of shares, often broken down into par value and additional paid-in capital. It can include both common stock and preferred stock.
- Retained Earnings: This represents the cumulative net income that the firm has reinvested in the business rather than paying out as dividends to shareholders.
- Statement of Stockholders’ Equity: This specific report tracks changes in these accounts over time, showing how equity was affected by net income, dividend payments, and the issuance or repurchase of stock.
Book Value vs. Market Value
A critical distinction in corporate finance is made between the book value of equity and its market value, also known as market capitalization.
- Calculation of Market Value: Market capitalization is calculated by multiplying the current market price per share by the total number of shares outstanding.
- Reasons for Discrepancy: The book value is often an inaccurate assessment of a firm’s true value because assets are recorded at historical cost rather than current market value. Furthermore, many of a firm’s most valuable assets—such as employee expertise, brand reputation, and customer relationships—are entirely excluded from the balance sheet.
- Market-to-Book Ratio: This ratio compares a firm’s market capitalization to its book value. For successful firms, this ratio typically exceeds 1.0, reflecting the value added by management and the firm’s future growth prospects.
Equity as a Measure of Leverage and Return
Within the context of financial statement analysis, equity serves as a denominator for several key performance and risk metrics:
- Return on Equity (ROE): Calculated as net income divided by the book value of equity, this ratio measures the return the firm has earned on past investments.
- Equity Multiplier: This leverage ratio (Total Assets / Book Value of Equity) indicates the extent to which a firm uses debt to amplify its accounting returns.
- Impact of Share Repurchases: Extensive stock buyback programs can significantly reduce the book value of equity, sometimes even to negative levels, which can make ratios involving book equity difficult to interpret.
Legal and Control Rights
Beyond its accounting definition, equity represents a specific legal relationship between the firm and its owners.
- Limited Liability: Shareholders have limited liability, meaning they cannot be held personally responsible for the firm’s debts beyond the amount of their initial investment.
- Residual Control: While stockholders often delegate daily operations to professional managers, they retain ultimate control rights, including the right to elect the board of directors and vote on major corporate actions like mergers.
- Corporate Forms: While most corporations are subject to double taxation on equity income, specific forms like “S” corporations or “Benefit” corporations allow for different tax treatments or the explicit inclusion of social goals in their governing articles.
Market vs Book Value
In corporate finance, the balance sheet serves as a snapshot of a firm’s financial position, but it fundamentally reflects accounting values rather than current market realities. The distinction between market and book value is a central theme in financial statement analysis, as they provide very different perspectives on a firm’s worth and its future prospects.
Book Value: The Accounting Measure
The book value of a firm’s equity, also known as stockholders’ equity, is defined as the difference between the book value of its assets and its total liabilities.
- Historical Cost Basis: Most assets on a balance sheet are recorded at their original acquisition cost rather than their current value today.
- Depreciation and Amortization: For tangible assets like plant and equipment, accountants deduct a fixed annual amount for depreciation to reflect the asset being “used up” over time. Similarly, intangible assets acquired through mergers may be reduced by amortization or impairment charges.
- Missing Intangibles: A primary limitation noted in the sources is that many of a firm’s most valuable assets—such as employee expertise, brand reputation, management quality, and customer relationships—are often entirely excluded from the balance sheet unless they were part of a previous acquisition.
Market Value: The Investor’s Perspective
The market value of equity, or market capitalization, represents the total price investors are willing to pay for all the firm’s outstanding shares.
- Forward-Looking Nature: Unlike book value, which is backward-looking and based on historical investment, market value depends on what investors expect the firm’s assets to produce in the future.
- Calculation: Market value is calculated by multiplying the current market price per share by the total number of shares outstanding.
- Market-to-Book Ratio: This ratio (Market Value of Equity / Book Value of Equity) measures how much value management has added to the capital contributed by shareholders. For successful firms, this ratio typically exceeds 1.0, while a ratio below 1.0 suggests that investors believe the firm’s assets are worth less than their historical cost.
Factors Causing Discrepancies
The sources identify several reasons why book value is often an inaccurate assessment of a firm’s true economic value:
- Accounting Conventions: Generally Accepted Accounting Principles (GAAP) often require outlays like Research and Development (R&D) to be expensed immediately rather than capitalized as investments, which can suppress book values for growth-oriented firms.
- Impact of Share Repurchases: In corporate finance, it is highlighted that active stock buyback programs can significantly reduce book equity, sometimes even to near-zero or negative levels, which can make ratios using book value as a denominator difficult to interpret.
- Liquidation vs. Going-Concern Value: Book value simple adds up individual asset costs, failing to capture “going-concern value”—the additional worth created when assets are organized into a healthy, operating business.
Broader Valuation Context
Beyond the simple equity comparison, the sources introduce other market-based metrics for comprehensive analysis:
- Enterprise Value: This measures the total value of the underlying business operations, calculated as the market value of equity plus the firm’s debt, minus its cash. It is interpreted as the net cost to take over the entire business.
- Market Value Added (MVA): This is the literal difference between the total market value of the shares and the cumulative amount shareholders have invested in the firm over time.
- Economic Value Added (EVA): While based on accounting data, EVA attempts to bridge the gap by measuring a firm’s profit after deducting the actual cost of the capital (debt and equity) employed, showing whether value was truly created for investors.
Enterprise Value
In corporate finance, enterprise value (EV) represents the total market value of a firm’s underlying business operations, separate from its cash holdings. While the standard balance sheet reports the historical book values of assets and liabilities, enterprise value provides a market-based assessment of what the firm’s productive assets are worth today.
Calculation and Components
Enterprise value is derived by aggregating the market values of the firm’s capital sources and subtracting its cash reserves:
- Formula: Enterprise Value = Market Value of Equity + Debt – Cash.
- Market Value of Equity: Also known as market capitalization, this is the current share price multiplied by the total number of shares outstanding.
- Debt: This includes all interest-bearing obligations, such as short-term debt, notes payable, and long-term debt.
- Cash and Marketable Securities: Because a firm could theoretically use its cash to pay down its debt immediately, cash is subtracted to find the “net” cost of the business. Some practitioners specify subtracting only “excess cash” not required for daily operations.
Relationship to the Balance Sheet
Within the framework of corporate finance, enterprise value is best understood through the market value balance sheet.
- Net Cost to Take Over: Enterprise value is often interpreted as the literal “cost to take over the business”. It represents the net amount an acquirer would pay to buy out all equity holders and satisfy all debt holders, while simultaneously acquiring the firm’s cash.
- Asset-Side Focus: While the standard accounting balance sheet lists assets at historical cost, EV measures the market’s current valuation of the assets on the left-hand side of the balance sheet (the firm’s investments).
- Net Debt: The difference between total debt and cash is referred to as net debt. Using this concept, enterprise value can be simplified as the sum of market capitalization and net debt.
Utility in Financial Analysis
Enterprise value is a critical metric because it provides a more robust basis for comparison than equity value alone, particularly when firms have different capital structures:
- Comparing Levered Firms: corporate finance emphasizes that equity-based ratios, like the price-earnings (P/E) ratio, are highly sensitive to a firm’s choice of leverage. In contrast, valuation multiples based on enterprise value (such as EV-to-EBITDA, EV-to-EBIT, or EV-to-Sales) assess the value of the entire business relative to the total earnings available to both debt and equity holders.
- Valuation Modeling: The discounted free cash flow model is the primary method for determining a firm’s enterprise value. In this model, the firm’s future free cash flows are discounted using the weighted average cost of capital (WACC), which accounts for the risk of the firm’s combined debt and equity.
- Leverage Measurement: Analysts often use the debt-to-enterprise value ratio to determine what fraction of a firm’s underlying business activity is financed through debt.
Ultimately, while the balance sheet provides the mandatory “snapshot” of financial position, enterprise value serves as the essential market-based “compass” for valuation and strategic decision-making in corporate finance.
Income Statement
In corporate finance, the income statement—also referred to as the statement of financial performance—is defined as a report that lists a firm’s revenues and expenses over a specific period of time. While the balance sheet acts as a “snapshot” of a firm’s position at a moment in time, the income statement is described as a “video” that depicts the flow of activity between two dates.
Structure and Core Components
The statement follows a standardized sequence to calculate the firm’s “bottom line,” which is net income (also called earnings).
- Gross Profit: This is the initial calculation of the difference between total sales/revenues and the cost of sales (direct manufacturing or production costs).
- Operating Income: Calculated by subtracting operating expenses from gross profit. These include selling, general, and administrative (SG&A) expenses, research and development (R&D), and non-cash charges like depreciation and amortization.
- EBIT (Earnings Before Interest and Taxes): This level of profit is reached after adjusting operating income for other, non-operating sources of income or expense.
- Net Income: To arrive at the final earnings, the firm deducts interest expenses (related to outstanding debt) and corporate taxes from EBIT.
Role in Financial Statement Analysis
The income statement is the primary source for computing profitability ratios, which allow analysts to evaluate efficiency and compare firms within an industry:
- Margins: Common metrics include the gross margin (gross profit divided by sales), the operating margin (operating income divided by sales), and the net profit margin (net income divided by sales).
- Earnings per Share (EPS): This widely cited metric is net income divided by the total number of shares outstanding, providing the earnings attributed to each individual share.
- DuPont Identity: Analysis of the income statement is central to the DuPont Identity, which links the net profit margin to other factors like asset turnover and financial leverage to explain the firm’s Return on Equity (ROE).
Contextual Nuances and Limitations
corporate finance highlights several critical distinctions that analysts must consider when reviewing an income statement:
- Earnings vs. Cash Flow: A fundamental point is that earnings do not represent actual cash generated. Non-cash items like depreciation reduce reported profit but are not cash outflows. Conversely, major cash uses like capital expenditures (purchasing equipment) appear on the balance sheet but not directly as an expense on the income statement.
- Accounting Assumptions: The reliability of reported earnings depends on the Generally Accepted Accounting Principles (GAAP) and the specific assumptions management makes regarding the timing of revenue recognition and the method of depreciation.
- Impact of Leverage: Net profit margin and EPS are sensitive to a firm’s choice of debt (leverage) because interest expenses reduce net income. For this reason, analysts often utilize EBITDA (earnings before interest, taxes, depreciation, and amortization) as a more robust measure of operating cash flow available to satisfy all security holders.
Gross Profit
In corporate finance, gross profit is defined as the difference between total sales revenues and the cost of sales (also referred to as cost of goods sold), representing the first level of profitability reported on the income statement. While the income statement depicts the flow of activity between two dates, gross profit specifically isolates the surplus generated from the direct production or purchase of goods before other operating and financial obligations are considered.
Position and Components
Within the standardized sequence of the income statement, gross profit is the third line item, calculated immediately after deducting the direct manufacturing and production costs from total revenues.
- Included Costs: Only costs directly related to producing the goods or services being sold—such as raw materials and direct labor—are deducted to arrive at gross profit.
- Excluded Costs: Other operational expenses, such as selling, general, and administrative (SG&A) expenses, research and development (R&D), and interest expenses, are not included in this calculation.
Analytical Significance: The Gross Margin
The primary tool used by analysts to evaluate gross profit is the gross margin, which is the ratio of gross profit to total sales revenues.
- Efficiency and Pricing Power: A firm’s gross margin reflects its fundamental ability to sell a product for significantly more than the cost of producing it.
- Comparison Examples: In 2022, Global Conglomerate Corporation achieved a gross profit of $33.3 million on sales of $186.7 million, resulting in a gross margin of 17.8%. Large retailers like Walmart and Target also demonstrate this mechanic; for instance, in 2019, Walmart reported net sales of $523,964 million against a cost of goods sold of $394,605 million.
Relationship to Other Income Tiers
Gross profit serves as the starting point for subsequent profitability measures on the income statement:
- Operating Income: This is derived by taking gross profit and subtracting operating expenses, including SG&A, R&D, and non-cash charges like depreciation and amortization.
- Net Income: Often called the “bottom line,” net income is the final earnings available to equity holders after deducting interest and taxes from the operating results.
Ultimately, while gross profit demonstrates the efficiency of a firm’s core production process, corporate finance notes that it must be considered alongside other margins to determine if a company’s business strategy—such as Walmart’s high-volume, low-margin model—is successfully translating into final earnings.
Operating Income
In the framework of corporate finance, operating income represents a firm’s profit from its core business operations, calculated by subtracting operating expenses from gross profit. While the income statement acts like a “video” depicting the flow of activity over a specific period, operating income specifically isolates the performance of the business itself before the effects of financing and taxes are considered.
Calculation and Components
Operating income is the result of deducting operating expenses from the firm’s gross profit.
- Operating Expenses: These are costs incurred during the ordinary course of business that are not directly tied to the production of goods. They include selling, general, and administrative (SG&A) expenses, overhead, marketing, and research and development (R&D).
- Non-Cash Charges: Operating expenses also include depreciation and amortization. These are accounting estimates of the wear and tear or obsolescence of assets and do not represent actual cash outflows.
- Transition to EBIT: Once operating income is adjusted for other non-operating sources of income or expense (such as income from financial investments), the result is Earnings Before Interest and Taxes (EBIT).
Analytical Significance: The Operating Margin
The primary analytical tool derived from this figure is the operating margin, which is the ratio of operating income to total sales revenues.
- Efficiency Benchmarking: By comparing operating margins across firms within the same industry, analysts can assess the relative efficiency of their operations.
- Strategic Insights: Differences in operating margins often reflect distinct corporate strategies. For example, a high-end retailer may have high margins on low volume, while a discount retailer like Walmart utilizes a low-margin, high-volume strategy to generate earnings.
- Alternative Definitions: In some contexts, such as those described in Principles of Corporate Finance, analysts utilize an operating profit margin calculated by adding back after-tax interest to net income. This version is intended to ensure a firm is not perceived as less profitable simply because it chooses to use debt financing.
Role in Capital Budgeting and Valuation
Operating income is central to the capital budgeting process because it serves as the foundation for determining a project’s potential value.
- Incremental Earnings: In corporate finance, managers often begin the capital budgeting process by forecasting the incremental operating income (EBIT) a project will contribute.
- Unlevered Net Income: Operating income is used to calculate unlevered net income, which evaluates a project’s profitability as if the firm had no debt. This is achieved by starting with EBIT and deducting the applicable marginal corporate taxes.
- Return on Assets (ROA): Operating income is a key component of the DuPont Identity, where the operating profit margin is multiplied by asset turnover to explain a firm’s total return on assets.
Operating Income versus Cash Flow
corporate finance emphasizes that operating income is an accounting measure and not a direct representation of cash generated. Because operating expenses include non-cash items like depreciation, a firm can report positive operating income while simultaneously experiencing negative cash flow if its investment needs or working capital requirements are high. To find actual free cash flow, analysts must adjust operating income by adding back depreciation and subtracting capital expenditures and increases in net working capital.
EBIT
In corporate finance, Earnings Before Interest and Taxes (EBIT) is defined as a measure of a firm’s profitability that includes all profits earned before the deduction of interest expenses and corporate taxes. While the income statement functions like a “video” depicting the flow of a company’s financial activity over a period, EBIT serves as a critical intermediate subtotal that isolates the results of a firm’s operations and investments from its financing and tax environment.
Calculation on the Income Statement
Within the standardized structure of the income statement, EBIT is reached through a specific sequence of deductions:
- From Gross Profit to Operating Income: The calculation begins by taking the firm’s gross profit (Sales minus Cost of Goods Sold) and subtracting operating expenses, such as selling, general, and administrative (SG&A) costs and research and development (R&D). This result is the firm’s operating income.
- Adjusting for Non-Operating Items: To arrive at EBIT, operating income is adjusted for other sources of income or expenses that are not part of the firm’s central business operations, such as income from financial investments.
- To Net Income: From EBIT, interest expenses related to outstanding debt are deducted to find pretax income, and corporate taxes are then subtracted to determine the “bottom line” of net income.
Analytical Significance
Corporate finance emphasizes EBIT as a robust tool for performance comparison because it represents the earnings available to satisfy all of a company’s investors—both debt holders and equity holders.
- Capital Structure Neutrality: Because it is calculated before interest, EBIT allows analysts to compare the operating efficiency of firms regardless of whether they are financed primarily by debt or equity.
- EBIT Margin: This ratio (EBIT / Sales) is used to assess relative efficiency across firms within an industry. For example, a high-end retailer might have a high EBIT margin on low volume, while a discount retailer like Walmart maintains a low EBIT margin but generates profit through high volume.
- Interest Coverage: Lenders frequently use the times-interest-earned ratio (EBIT / Interest Expense) to gauge a company’s ability to meet its debt obligations. A ratio below 1.5 may lead creditors to question a firm’s ability to repay its debts.
Role in Valuation and Capital Budgeting
EBIT serves as a foundation for many modern valuation and budgeting techniques:
- Valuation Multiples: Investors often use enterprise value to EBIT (EV/EBIT) multiples to price a business. This is considered more reliable than equity-based multiples (like P/E ratios) when comparing companies with markedly different levels of leverage.
- Forecasting Project Earnings: In the capital budgeting process, managers typically begin by forecasting the incremental EBIT a new project is expected to contribute to the firm.
- Break-Even Analysis: Firms calculate the EBIT break-even level of sales to determine the volume at which a project’s operating earnings will be exactly zero.
Regulatory and Tax Context
Beyond its use in internal analysis, EBIT has acquired regulatory importance. For instance, tax laws in the United States and the EU now limit the amount of interest a large corporation can deduct to 30% of its EBIT. Consequently, projects that generate higher EBIT can be particularly valuable to tax-paying firms by allowing them to unlock higher interest tax shields on their existing debt.
Net IncomeBottom of Form
In corporate finance, net income—often referred to as the firm’s “earnings”—is the final line or “bottom line” of the income statement. It represents the total profit available to a company’s equity holders after all revenues and expenses for a specific period have been accounted for.
The Calculation Process
According to corporate finance, net income is derived through a standardized sequence of deductions from total sales reported on the income statement:
- From Revenue to Operating Income: The process begins by subtracting the cost of sales from total revenue to reach gross profit, then deducting operating expenses (such as administrative overhead, salaries, marketing, and research and development) to determine operating income.
- Non-Cash Operating Charges: Operating expenses also include depreciation and amortization, which are accounting estimates of the wear and tear on assets rather than actual cash outflows.
- To EBIT and Net Income: Operating income is adjusted for other non-operating sources of income or expense to arrive at Earnings Before Interest and Taxes (EBIT). From EBIT, interest expenses are deducted to find pretax income, and corporate taxes are finally subtracted to reach net income.
Per-Share Metrics and Dilution
Corporate finance highlights that net income is frequently reported on a per-share basis as Earnings Per Share (EPS), which is net income divided by the total number of shares outstanding. Companies must also report diluted EPS, which computes earnings as though all “in-the-money” stock options, restricted stock grants, or dilutive convertible debt had already been exercised or converted.
Role in Financial Ratio Analysis
Net income is a central component for several key performance and profitability ratios used in corporate finance:
- Net Profit Margin: This ratio (Net Income / Sales) shows the fraction of each dollar in revenue that is available to equity holders after the firm satisfies all obligations, including interest and taxes.
- Return on Equity (ROE): Calculated as net income divided by the book value of equity, this ratio measures the return a firm has earned on past investments.
- DuPont Identity: This analytical tool utilizes the net profit margin as one of three primary components (alongside asset turnover and leverage) to explain a firm’s overall ROE.
Net Income versus Cash Flow
A recurring theme in the sources is that net income is an accounting measure and not a direct representation of cash generated. Corporate finance explains that net income may not correspond to cash for two reasons: non-cash entries like depreciation are deducted on the income statement, and significant cash uses (such as purchasing equipment or inventory) are not reported there. To find actual free cash flow, analysts must adjust net income by adding back depreciation and subtracting capital expenditures and increases in net working capital.
Valuation and Policy Implications
- Unlevered Net Income: When evaluating capital budgeting decisions, managers often use “unlevered net income,” which calculates a project’s potential earnings as if the firm had no debt by starting with EBIT and deducting only taxes.
- Retained Earnings: The difference between a firm’s net income and the amount it pays out in dividends is referred to as retained earnings, which are reinvested into the firm to support future growth.
- Sustainable Growth: A firm’s sustainable growth rate—the rate at which it can grow using only internal funds—is determined by the product of its return on equity and its plowback ratio (the fraction of net income retained).
Integrity and Disclosure
The accuracy of reported net income relies on Generally Accepted Accounting Principles (GAAP) and oversight by neutral third-party auditors. Corporate finance notes that historical scandals involving companies like Enron and WorldCom illustrate how manipulations—such as recording loans as revenue or misclassifying operating expenses as capital expenditures—can artificially inflate reported net income to deceive investors.
Earnings Per Share (EPS)
In corporate finance, Earnings Per Share (EPS) is the portion of a firm’s net income—the “bottom line” of the income statement—attributed to each individual share of outstanding stock. It is a standardized metric that translates total company earnings into a per-share figure, making it a primary tool for communicating past performance to shareholders.
Calculation and Reporting
The calculation of EPS involves taking the firm’s net income and dividing it by the total number of shares outstanding. Because net income is determined after interest and taxes have been deducted from operating results, EPS represents the final amount of profit available to equity holders. On the income statement, this figure provides a “video” of the flow of earnings generated by the firm’s assets over a specific period, in contrast to the balance sheet “snapshot” of a firm’s position at a moment in time.
Basic vs. Diluted EPS
Corporate finance emphasizes that a basic EPS figure can be misleading if a firm has issued securities that could potentially increase the number of shares in the future.
- Dilution: The number of shares outstanding may grow if a company compensates employees with stock options or restricted stock grants, or if it issues convertible bonds. This process is known as dilution because the same pool of earnings must be divided among more shares.
- Diluted EPS: Firms are required to disclose this potential by reporting diluted EPS, which computes earnings as though all “in-the-money” options, stock grants, or dilutive convertible debt had already been exercised or converted. This provides investors with a more conservative and realistic view of their claim on earnings.
Role in Valuation: The P/E Ratio
EPS is a foundational component of the Price-Earnings (P/E) ratio, one of the most common valuation multiples used in corporate finance. The P/E ratio is calculated by dividing the current share price by the EPS. This ratio allows analysts to gauge whether a stock is over- or under-valued based on the idea that the value of a stock should be proportional to the level of earnings it generates. Firms with high expected growth rates typically trade at higher P/E multiples, reflecting the value investors place on future rather than current earnings.
Leverage and the EPS Fallacy
A recurring theme in corporate finance is the impact of financial leverage on EPS.
- Increasing EPS through Debt: Using debt to repurchase shares (a leveraged recapitalization) can often increase a firm’s expected EPS because the reduction in share count can outweigh the decrease in net income caused by new interest expenses.
- The Risk Offset: However, corporate finance labels the idea that this increase automatically raises the stock price as a “fallacy”. While expected EPS may rise, the riskiness of those earnings also increases because they become more sensitive to fluctuations in operating income. In a perfect market, the higher return required by shareholders to compensate for this risk exactly offsets the higher EPS, leaving the share price unchanged.
- Comparability Limitation: Because EPS is highly sensitive to a firm’s choice of leverage, it is considered an unreliable metric for comparing the fundamental performance of firms with different capital structures.
EPS in Strategic and Accounting Contexts
The sources also highlight how EPS can be affected by specific corporate events or accounting choices:
- The Bootstrap Effect: In mergers, the “bootstrap game” occurs when a firm acquires another company with a lower P/E ratio. This can result in an immediate increase in the acquirer’s EPS even if the merger creates no real economic value or synergy.
- Financial Signaling: Dividend increases are often viewed as more credible signals of management’s confidence than EPS forecasts, as firms may occasionally use off-balance-sheet arrangements or accounting “tricks” to temporarily inflate reported EPS.
- Value of the Share: One source clarifies that while EPS is a popular metric, the “true” value of a share is the present value of the discounted stream of dividends (or total payouts), not the discounted stream of earnings, because earnings include funds retained for reinvestment rather than just cash returned to owners.
Statement of Cash Flows
In corporate finance, the statement of cash flows is identified as one of the four mandatory financial reports required of public companies, serving as a vital link between the income statement and the balance sheet. While the income statement provides a measure of profitability, it does not reflect the actual cash generated; the statement of cash flows fills this gap by determining how much cash a firm has produced and how that cash has been allocated over a specific period.
Core Structure and Components
The statement is standardized into three primary sections that categorize a firm’s cash movements:
- Operating Activities: This section begins with net income and adjusts it for all non-cash items—such as depreciation and amortization—and changes in net working capital. Increases in accounts receivable or inventory are recorded as cash outflows, while increases in accounts payable are cash inflows.
- Investing Activities: This part lists the cash used for long-term investments, primarily capital expenditures (CapEx) for property, plant, and equipment, as well as cash used for acquisitions or the purchase of marketable securities.
- Financing Activities: This section tracks the flow of cash between the firm and its investors. It includes cash inflows from issuing debt or equity and cash outflows for dividend payments, share repurchases, and debt repayments.
Analytical Significance in Financial Analysis
Within the larger context of financial statement analysis, the statement of cash flows provides unique insights that traditional earnings metrics cannot:
- Earnings Quality and Integrity: In corporate finance, the statement is used as an audit tool to detect potential reporting abuses. For instance, a significant deviation between reported net income and actual operating cash flow—often caused by aggressive revenue recognition or capitalized expenses—can be a “red flag” for investors.
- Solvency and Liquidity Assessment: By combining the cash flows from all three activities, analysts can determine the firm’s overall change in cash balance. A firm reporting positive net income can still face a cash shortage if its operating activities do not generate sufficient funds to cover its investment and financing needs.
- Free Cash Flow Calculation: The data from this statement is essential for determining free cash flow (FCF)—the cash available for distribution to all security holders after satisfying all necessary investments. FCF is often considered the most important piece of information for investors attempting to value a firm through discounted cash flow models.
The “Cash Flow vs. Earnings” Distinction
A recurring theme in corporate finance is the adage that “cash flow is a fact and earnings are an opinion”. Because net income is subject to many accounting rules and management assumptions, analysts rely on the statement of cash flows to see the “clear economics” of a business. For example, a company like Global Conglomerate Corporation might show a positive net income of $2.0 million but actually have a negative cash flow from operating activities due to high growth in its accounts receivable. Consequently, corporate finance emphasizes that the statement of cash flows is often the most critical report for assessing a firm’s true financial performance and its ability to remain in business.
Operating Activities
In corporate finance, the section for operating activities is the first of three primary components on the statement of cash flows, serving as a critical bridge between the firm’s accrual-based net income and its actual cash generation. While the income statement records profits when sales are made, the operating activities section of the cash flow statement adjusts these “accounting opinions” to reveal the “factual” cash produced by the business.
Calculation and Adjustments
The calculation for cash from operating activities typically starts with net income and then applies several specific adjustments to reach the actual cash flow:
- Adding Back Non-Cash Expenses: Since items like depreciation and amortization are deducted to reach net income but do not involve an actual cash outlay, they are added back. Other non-cash items, such as stock-based compensation or increases in deferred taxes, are also added back.
- Adjusting for Working Capital Changes: This is a vital step where changes in current assets and liabilities (excluding cash and debt) are accounted for.
- Accounts Receivable: An increase in receivables is a “use” of cash (deducted) because it represents sales made on credit for which cash has not yet been received.
- Inventory: An increase in inventory is a “use” of cash (deducted) because the firm has spent money to acquire goods that have not yet been sold.
- Accounts Payable: An increase in payables is a “source” of cash (added) because it represents a form of borrowing from suppliers.
Analytical Significance
Within the larger context of financial statement analysis, operating activities provide unique insights into a firm’s health:
- Quality of Earnings: Analysts look for a close alignment between net income and cash from operating activities. Significant deviations—such as positive net income paired with negative operating cash flow—can be a “red flag” for aggressive accounting or potential liquidity issues.
- True Profitability: Because earnings can be influenced by diverse accounting rules and management assumptions, cash flow from operations is often viewed as a clearer measure of the economics of a business.
- Liquidity and Solvency: For some highly levered firms, such as those in the airline industry, operating cash flow can be a more important decision driver than earnings, as it determines the firm’s immediate ability to service debt.
Role in Valuation and Planning
Operating activities are the foundation for more advanced financial metrics and models:
- Free Cash Flow (FCF): In corporate finance, FCF is often derived by starting with cash from operating activities and then subtracting capital expenditures. FCF represents the total cash available for distribution to all of the firm’s investors.
- Cash Budgeting: When forecasting future needs, firms use their expected operating activities to determine if they will face temporary cash deficits that require short-term financing.
Ultimately, corporate finance emphasizes that while a firm may show a positive bottom line on its income statement, its long-term survival depends on its ability to consistently generate positive cash from its core operating activities.
Investment Activities
In corporate finance, the section for investment activities is the second of three primary components on the statement of cash flows. It serves as a record of the cash used by a firm to acquire long-term assets intended to produce future benefits, as well as the cash received from the disposal of those assets.
Core Components of Investment Activities
The primary items reported under investment activities include:
- Capital Expenditures (CapEx): This is the most common component, representing cash spent on the purchase of new property, plant, and equipment (PPE). While these purchases do not appear as immediate expenses on the income statement, they are recorded as cash outflows in this section at the time of purchase.
- Acquisitions: When a firm buys another company, the cash paid for the acquisition—including any premium over the acquired firm’s book value (goodwill)—is listed here.
- Marketable Securities: The purchase or sale of long-term investments, such as stocks or bonds of other companies, is recorded in this section.
Accounting and Valuation Mechanics
Corporate finance emphasizes the distinction between how these investments are treated for accounting profit versus actual cash flow:
- Depreciation vs. CapEx: On the income statement, the cost of a long-term asset is spread out over its useful life as a non-cash depreciation expense. On the statement of cash flows, however, the entire cash outlay for the asset is subtracted in the period it occurs.
- Salvage Value: If a firm sells an asset at the end of its life, the net proceeds (salvage value) are recorded as a cash inflow in the investment activities section.
Analytical Significance
Investment activities provide critical insight into a firm’s strategy and financial health:
- Growth Indicator: Rapidly growing firms often report large negative cash flows from investing activities. For example, Global Conglomerate Corporation’s 2022 statement showed a $21 million outflow for investing, indicating significant expansion through both new equipment and acquisitions.
- Free Cash Flow (FCF) Base: Investment data is essential for determining a firm’s free cash flow, which is calculated by taking the cash from operating activities and subtracting capital expenditures. FCF represents the “true” cash available for distribution to all of the firm’s investors.
- Detection of Reporting Abuses: Because long-term investments must be deducted on the cash flow statement regardless of their accounting classification, this section can expose attempts to manipulate earnings. For instance, WorldCom’s move to reclassify operating expenses as capital expenditures boosted its reported “bottom line” on the income statement but created a visible “red flag” through massive, unexplained outflows in its investment activities.
Ultimately, while the income statement tracks profitability, corporate finance notes that an investor must look to the investment activities section to understand how much capital the firm is “plowing back” into the business to generate that future growth.
Financing Activities
In corporate finance, the section for financing activities is the final component of the statement of cash flows, illustrating the flow of funds between a firm and its investors, including both debt holders and equity holders. While the operating and investing sections focus on the business’s internal performance and asset base, financing activities reveal how the firm chooses to pay for those activities and return value to its owners.
Core Components of Financing Activities
The primary items reported in this section involve transactions with the firm’s capital providers:
- Equity Transactions: This includes cash inflows from the sale of the firm’s own stock and cash outflows used for stock repurchases. corporate finance notes that while these transactions change the number of shares outstanding, they do not affect the firm’s operating income but do impact its per-share metrics.
- Dividend Payments: Dividends paid to shareholders are recorded as a cash outflow. The difference between net income and these dividend payments represents the firm’s retained earnings for the period.
- Debt Transactions: This category tracks changes in the firm’s borrowing. Issuing new short-term or long-term debt is recorded as a cash inflow, while the repayment of debt principal is recorded as an outflow.
Analytical Significance
Within the larger context of financial statement analysis, the financing activities section provides essential insights into a firm’s strategy and solvency:
- Capital Gap Coverage: Analysts use this section to see how a firm covers its “financial deficit”—the gap when cash from operations is insufficient to cover investment needs. For example, a company may borrow heavily to fund negative operating cash flows or high capital expenditures, a pattern that may signal a need for more sustainable future funding.
- Payout Policy: The section explicitly shows the firm’s payout policy by detailing the mix of dividends and share repurchases used to distribute excess cash. corporate finance explains that while investors may be indifferent to the method of payout in a perfect market, the choice often signals management’s confidence in future earnings.
- Financial Health Indicator: The final line of the statement of cash flows combines financing with operating and investing activities to show the total change in the firm’s cash balance. A firm that must continually issue debt or equity to remain in business, rather than generating cash from operations, may face long-term viability concerns.
Link to the Balance Sheet and Income Statement
Corporate finance highlights that financing activities bridge the other core statements. For instance, interest payments are deducted to reach net income on the income statement, but the actual borrowing and principal repayments that affect the firm’s leverage are captured in the financing section of the cash flow statement and the liabilities section of the balance sheet. Similarly, the issuance or repurchase of shares directly impacts the Statement of Stockholders’ Equity, which breaks down the accounting net worth of the firm into contributed capital and retained earnings.
— Linden Lake
Leave a Reply